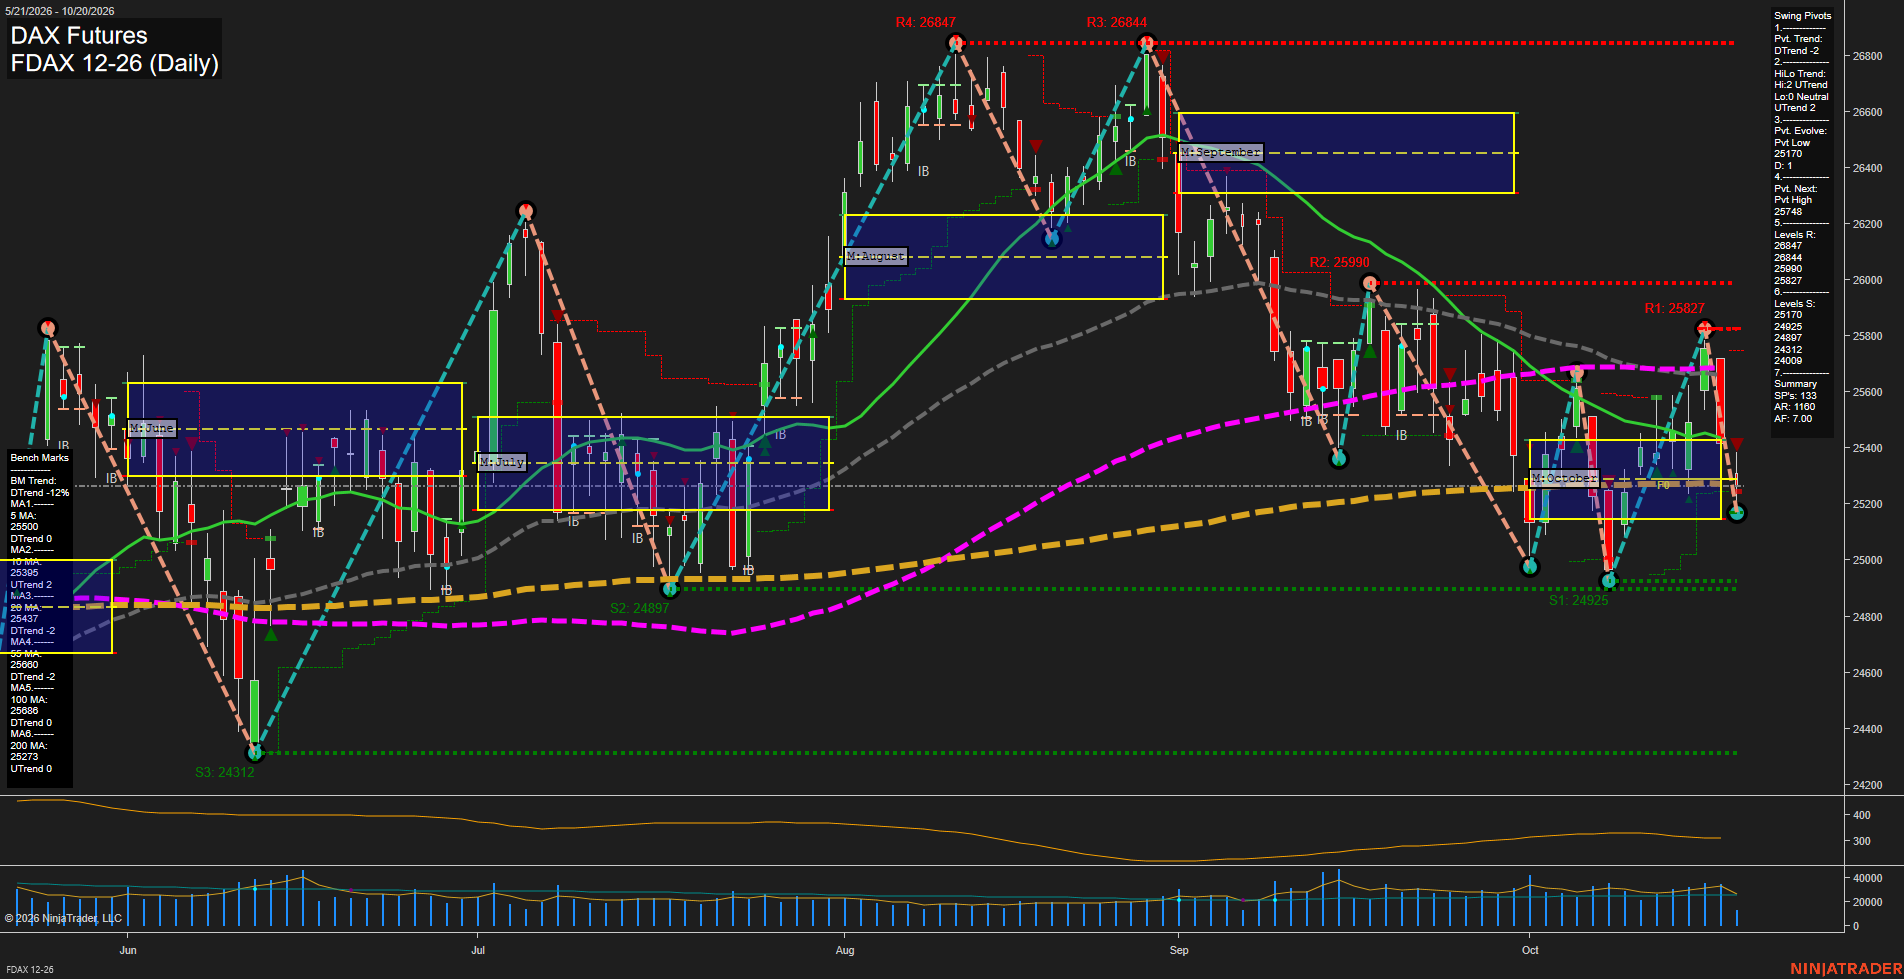
FDAX DAX Futures Daily Chart Analysis: 2026-Oct-20 07:04 CT
Price Action
- Last: 25313,
- Bars: Large,
- Mom: fast.
WSFG Weekly
- Short-Term
- WSFG Current: -66%
- F0%/NTZ' Bias: Price Below,
- WSFG Trend: Down.
MSFG Month Oct
- Intermediate-Term
- MSFG Current: 4%
- F0%/NTZ' Bias: Price Above,
- MSFG Trend: Up.
YSFG Year 2026
- Long-Term
- YSFG Current: 6%
- F0%/NTZ' Bias: Price Above,
- YSFG Trend: Up.
Swing Pivots
- (Short-Term) 1. Pvt. Trend: DTrend,
- (Intermediate-Term) 2. HiLo Trend: UTrend,
- 3. Pvt. Evolve: Pvt low 25170,
- 4. Pvt. Next: Pvt high 25748,
- 5. Levels R: 26847, 26844, 25990, 25827,
- 6. Levels S: 25170, 24925, 24897, 24312, 24309.
Daily Benchmarks
- (Short-Term) 5 Day: 25550 Down Trend,
- (Short-Term) 10 Day: 25390 Up Trend,
- (Intermediate-Term) 20 Day: 25437 Down Trend,
- (Intermediate-Term) 55 Day: 25680 Down Trend,
- (Long-Term) 100 Day: 25686 Down Trend,
- (Long-Term) 200 Day: 25273 Up Trend.
Additional Metrics
Recent Trade Signals
- 19 Oct 2026: Short FDAX 12-26 @ 25458 Signals.USAR.TR120
- 19 Oct 2026: Short FDAX 12-26 @ 25628 Signals.USAR-WSFG
- 13 Oct 2026: Long FDAX 12-26 @ 25370 Signals.USAR-MSFG
Overall Rating
- Short-Term: Bearish,
- Intermediate-Term: Neutral,
- Long-Term: Neutral.
Key Insights Summary
Price has reversed sharply from the 25827 swing-high area and closed beneath the 5-day and 20-day benchmarks, restoring a fast short-term downswing. The weekly grid remains negative and the pivot trend is down, while 25748 to 25827 is the principal rebound resistance zone. The intermediate pivot structure remains upward, supported by the positive monthly grid and the 25170 pivot-low level, but declining 20-day and 55-day averages show that this structure is undergoing a meaningful retracement. The 25273 200-day benchmark and clustered supports from 25170 to 24897 define the longer-term technical base, while a break below that band would extend the recent lower-high, lower-low sequence.
Chart Analysis ATS AI Generated: 2026-10-20 07:04 for Informational use only, not trading advice. Terms and Risk Disclosure Copyright © 2026. Algo Trading Systems LLC.