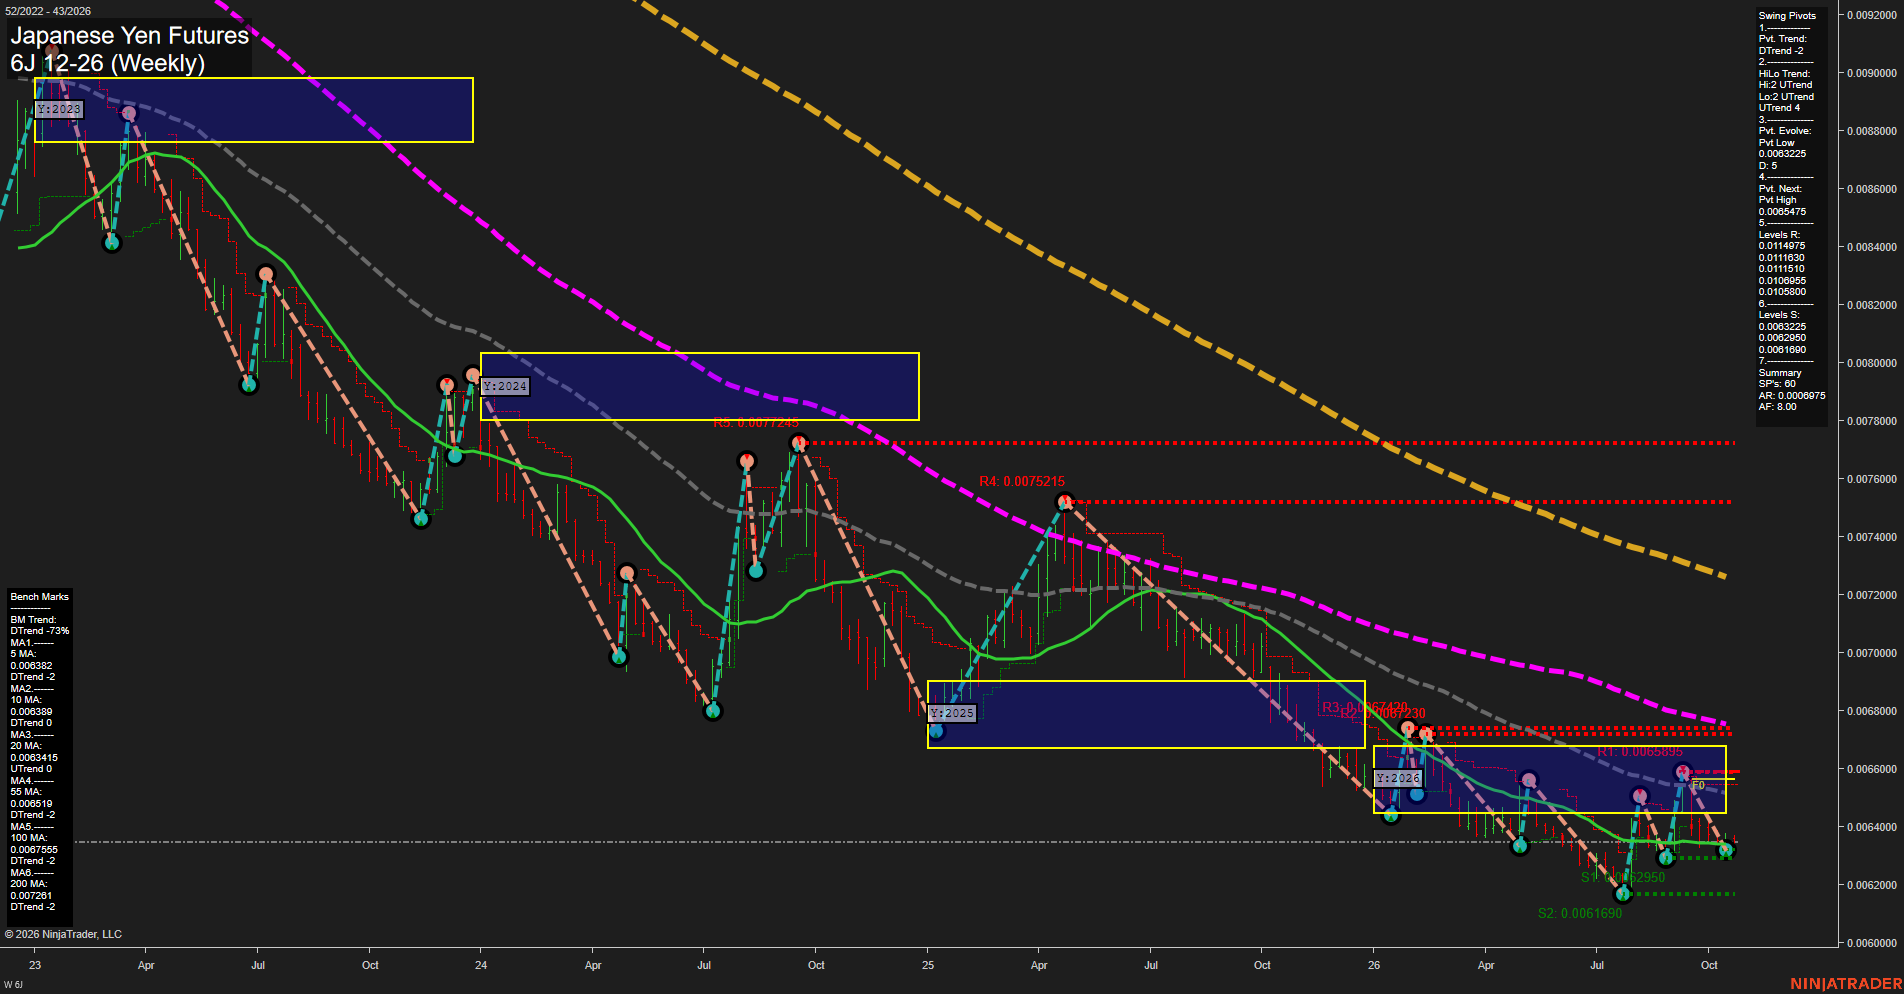
6J Japanese Yen Futures Weekly Chart Analysis: 2026-Oct-20 07:01 CT
Price Action
- Last: 0.006338,
- Bars: Small,
- Mom: Slow.
WSFG Weekly
- Short-Term
- WSFG Current: -13%
- F0%/NTZ' Bias: Price Below,
- WSFG Trend: Down.
MSFG Month Oct
- Intermediate-Term
- MSFG Current: -4%
- F0%/NTZ' Bias: Price Below,
- MSFG Trend: Down.
YSFG Year 2026
- Long-Term
- YSFG Current: -19%
- F0%/NTZ' Bias: Price Below,
- YSFG Trend: Down.
Swing Pivots
- (Short-Term) 1. Pvt. Trend: DTrend,
- (Intermediate-Term) 2. HiLo Trend: UTrend,
- 3. Pvt. Evolve: Pvt low 0.0063255,
- 4. Pvt. Next: Pvt high 0.0065475,
- 5. Levels R: 0.0114975, 0.0114030, 0.0111510, 0.0108955, 0.0105800,
- 6. Levels S: 0.0063255, 0.0062900, 0.0061890.
Weekly Benchmarks
- (Short-Term) 5 Day: 0.0063382 Down Trend,
- (Short-Term) 10 Day: 0.0063389 Down Trend,
- (Intermediate-Term) 20 Day: 0.0063415 Up Trend,
- (Intermediate-Term) 55 Day: 0.0065119 Down Trend,
- (Long-Term) 100 Day: 0.0067555 Down Trend,
- (Long-Term) 200 Day: 0.0072612 Down Trend.
Recent Trade Signals
- 19 Oct 2026: Short 6J 12-26 @ 0.006338 Signals.USAR-MSFG
- 19 Oct 2026: Short 6J 12-26 @ 0.006344 Signals.USAR.TR120
- 19 Oct 2026: Short 6J 12-26 @ 0.006353 Signals.USAR-WSFG
Overall Rating
- Short-Term: Bearish,
- Intermediate-Term: Bearish,
- Long-Term: Bearish.
Key Insights Summary
Price remains in a broad weekly downtrend, trading below the weekly, monthly, and yearly Fib-grid centers and beneath the declining 55, 100, and 200-period benchmarks. Small, slow-momentum bars near 0.00633 reflect consolidation around nearby support rather than an impulsive recovery. The short-term pivot structure remains DTrend, while the intermediate HiLo structure is attempting to stabilize, creating a countertrend base within the larger bearish cycle. Resistance at 0.0065475 and the higher benchmark cluster define the recent rebound ceiling, while 0.0063255, 0.0062900, and 0.0061890 mark the active support sequence. Recent short signals align with the prevailing short-, intermediate-, and long-term bearish technical structure.
Chart Analysis ATS AI Generated: 2026-10-20 07:01 for Informational use only, not trading advice. Terms and Risk Disclosure Copyright © 2026. Algo Trading Systems LLC.