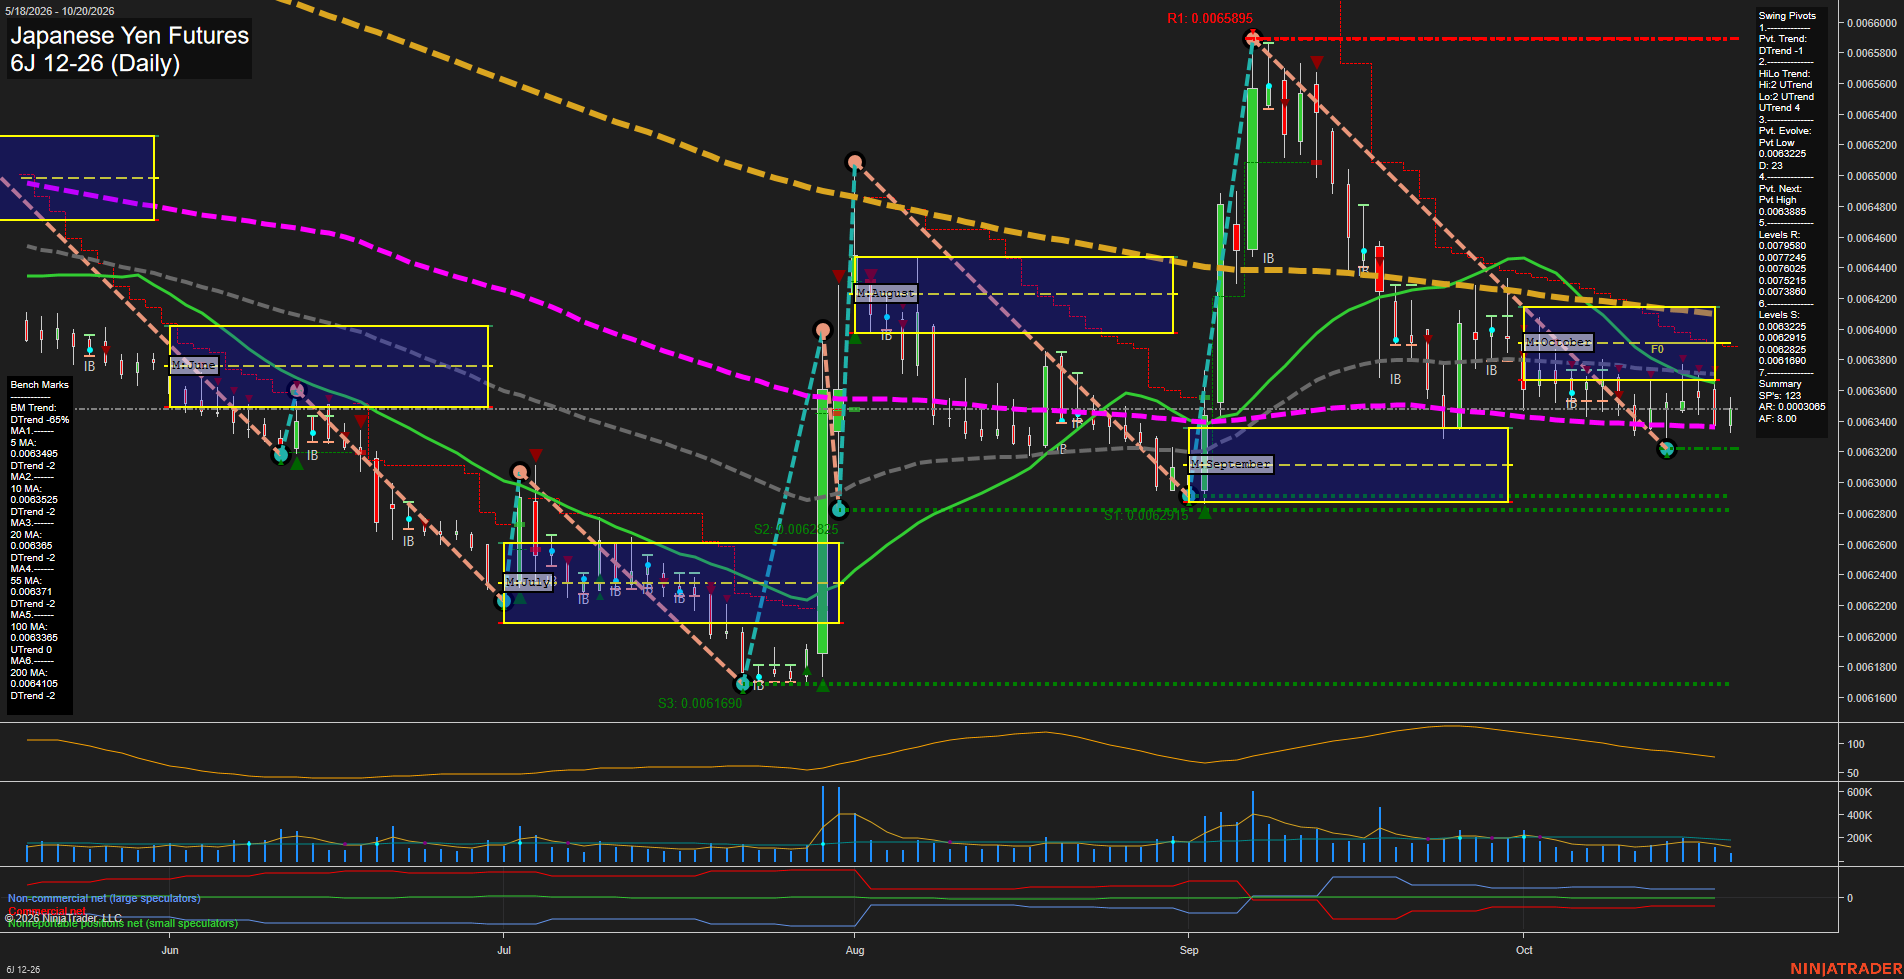
6J Japanese Yen Futures Daily Chart Analysis: 2026-Oct-20 07:01 CT
Price Action
- Last: 0.006348,
- Bars: Small,
- Mom: slow.
WSFG Weekly
- Short-Term
- WSFG Current: -13%
- F0%/NTZ' Bias: Price Below,
- WSFG Trend: Down.
MSFG Month Oct
- Intermediate-Term
- MSFG Current: -4%
- F0%/NTZ' Bias: Price Below,
- MSFG Trend: Down.
YSFG Year 2026
- Long-Term
- YSFG Current: -19%
- F0%/NTZ' Bias: Price Below,
- YSFG Trend: Down.
Swing Pivots
- (Short-Term) 1. Pvt. Trend: DTrend,
- (Intermediate-Term) 2. HiLo Trend: UTrend,
- 3. Pvt. Evolve: Pvt low 0.006325,
- 4. Pvt. Next: Pvt high 0.0068385,
- 5. Levels R: 0.0079580, 0.0077245, 0.0076025, 0.0073860, 0.0073215,
- 6. Levels S: 0.0063225, 0.0062915, 0.0062825, 0.0061690.
Daily Benchmarks
- (Short-Term) 5 Day: 0.0063495 Down Trend,
- (Short-Term) 10 Day: 0.0063525 Down Trend,
- (Intermediate-Term) 20 Day: 0.0063365 Down Trend,
- (Intermediate-Term) 55 Day: 0.0063710 Down Trend,
- (Long-Term) 100 Day: 0.0063305 Up Trend,
- (Long-Term) 200 Day: 0.0064105 Down Trend.
Additional Metrics
Recent Trade Signals
- 19 Oct 2026: Short 6J 12-26 @ 0.006338 Signals.USAR-MSFG
- 19 Oct 2026: Short 6J 12-26 @ 0.006344 Signals.USAR.TR120
- 19 Oct 2026: Short 6J 12-26 @ 0.006353 Signals.USAR-WSFG
Overall Rating
- Short-Term: Bearish,
- Intermediate-Term: Bearish,
- Long-Term: Bearish.
Key Insights Summary
Price is consolidating near 0.006348 after a sharp September rally failed beneath the 0.0065895 swing-high resistance area. The current short-term pivot structure is down, with small daily bars and slow momentum reflecting compression around the 5-, 10-, 20-, and 100-day averages. Price remains below weekly and monthly Fib-grid balance, while the declining 55- and 200-day benchmarks preserve the broader bearish technical backdrop. The intermediate HiLo trend remains up, showing the market is still holding above the larger September base, but the recent sequence of lower highs keeps the near-term swing cycle corrective. Support is clustered at 0.0063225 through 0.0062825, while the nearby 0.0063860 to 0.0064105 area defines overhead benchmark and pivot resistance.
Chart Analysis ATS AI Generated: 2026-10-20 07:01 for Informational use only, not trading advice. Terms and Risk Disclosure Copyright © 2026. Algo Trading Systems LLC.