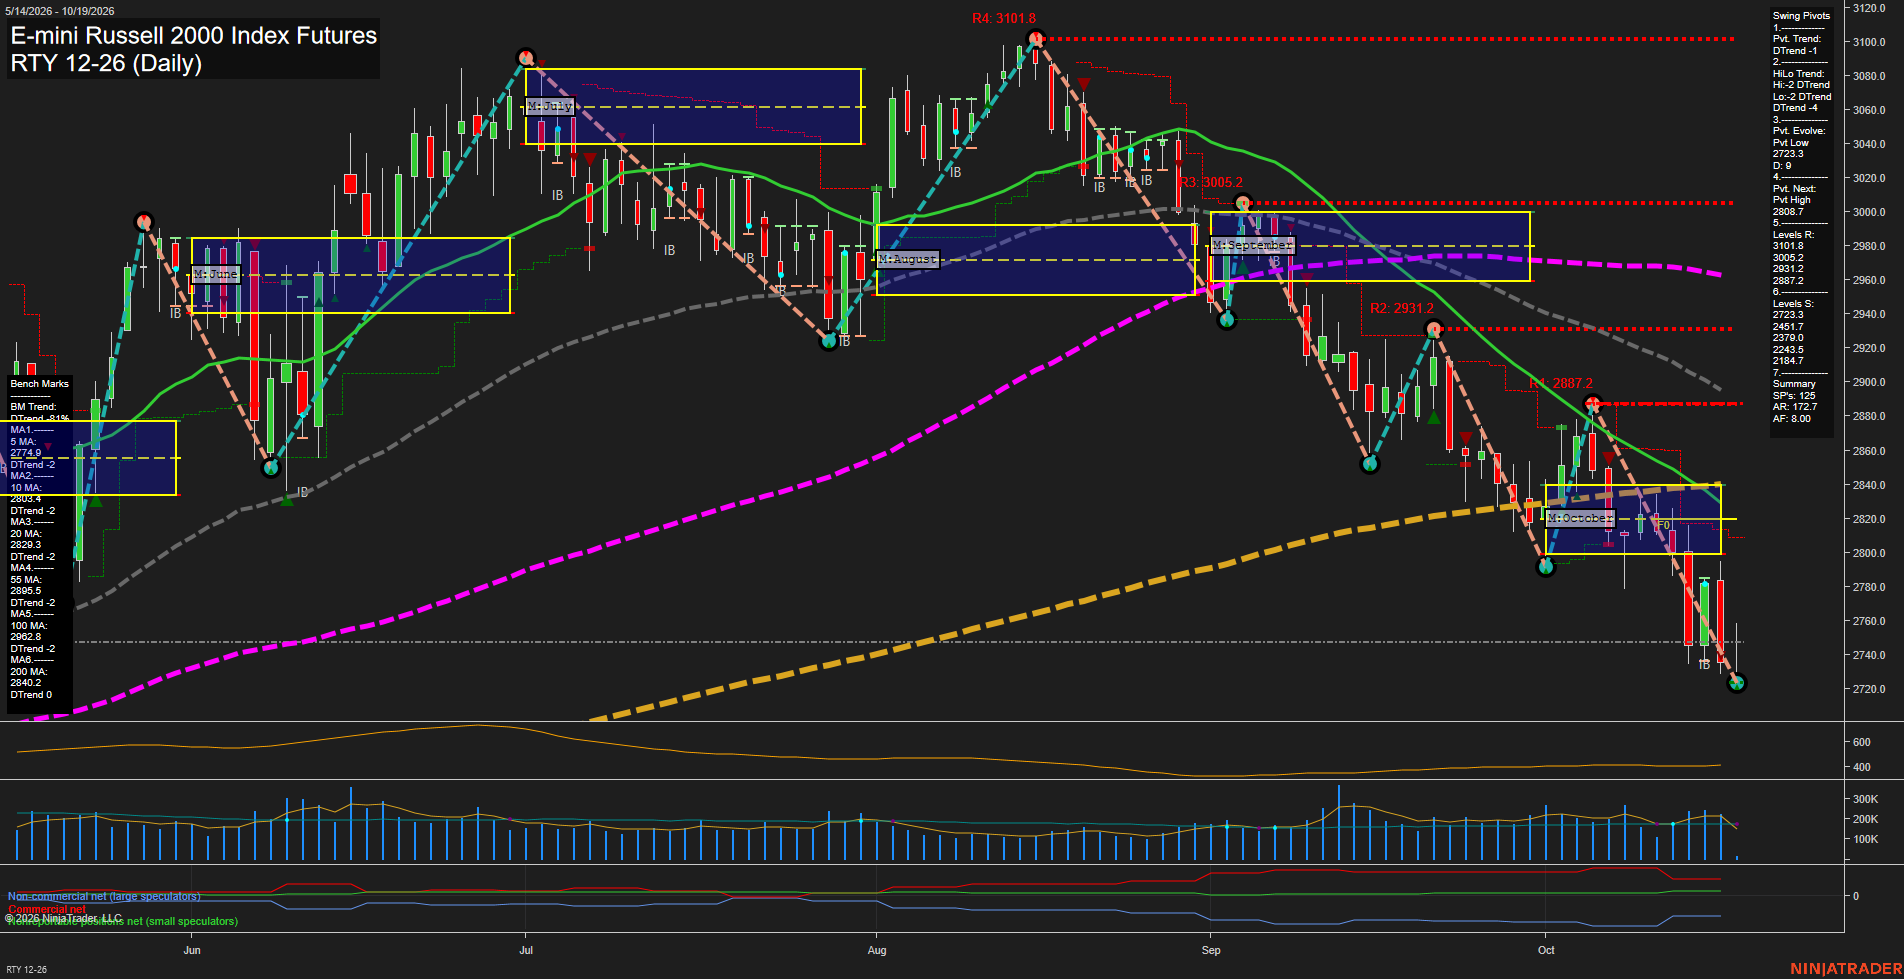
RTY E-mini Russell 2000 Index Futures Daily Chart Analysis: 2026-Oct-19 07:08 CT
Price Action
- Last: 2747.0,
- Bars: Large,
- Mom: fast.
WSFG Weekly
- Short-Term
- WSFG Current: 22%
- F0%/NTZ' Bias: Price Above,
- WSFG Trend: Up.
MSFG Month Oct
- Intermediate-Term
- MSFG Current: -56%
- F0%/NTZ' Bias: Price Below,
- MSFG Trend: Down.
YSFG Year 2026
- Long-Term
- YSFG Current: 24%
- F0%/NTZ' Bias: Price Above,
- YSFG Trend: Up.
Swing Pivots
- (Short-Term) 1. Pvt. Trend: DTrend,
- (Intermediate-Term) 2. HiLo Trend: DTrend,
- 3. Pvt. Evolve: Pvt low 2723,
- 4. Pvt. Next: Pvt high 2808.7,
- 5. Levels R: 3101.8, 3005.2, 2931.2, 2887.2,
- 6. Levels S: 2723.3, 2451.7, 2379.0, 2233.5, 2184.7.
Daily Benchmarks
- (Short-Term) 5 Day: 2774.9 Down Trend,
- (Short-Term) 10 Day: 2803.4 Down Trend,
- (Intermediate-Term) 20 Day: 2829.3 Down Trend,
- (Intermediate-Term) 55 Day: 2895.5 Down Trend,
- (Long-Term) 100 Day: 2962.8 Down Trend,
- (Long-Term) 200 Day: 2840.2 Down Trend.
Additional Metrics
Recent Trade Signals
- 16 Oct 2026: Short RTY 12-26 @ 2733.3 Signals.USAR.TR120
- 14 Oct 2026: Short RTY 12-26 @ 2804.4 Signals.USAR-MSFG
- 14 Oct 2026: Short RTY 12-26 @ 2804.4 Signals.USAR-WSFG
Overall Rating
- Short-Term: Bearish,
- Intermediate-Term: Bearish,
- Long-Term: Bearish.
Key Insights Summary
RTY is in a fast, high-range decline marked by lower swing highs and lower swing lows. Price is below every daily benchmark, with all moving-average trends pointed down, confirming broad downside alignment. The weekly fib position remains above its F0% level, but the monthly grid is below F0% and declining, reflecting a short-term counter-position within a stronger intermediate-term selloff. The 2723 pivot-low area is the immediate structural reference, while 2808.7 is the next pivot-reversal threshold. Resistance is layered overhead near 2887.2, 2931.2, 3005.2, and 3101.8, illustrating the extent of the preceding breakdown. Large bars and elevated ATR conditions indicate expanded volatility and persistent momentum rather than orderly consolidation.
Chart Analysis ATS AI Generated: 2026-10-19 07:08 for Informational use only, not trading advice. Terms and Risk Disclosure Copyright © 2026. Algo Trading Systems LLC.