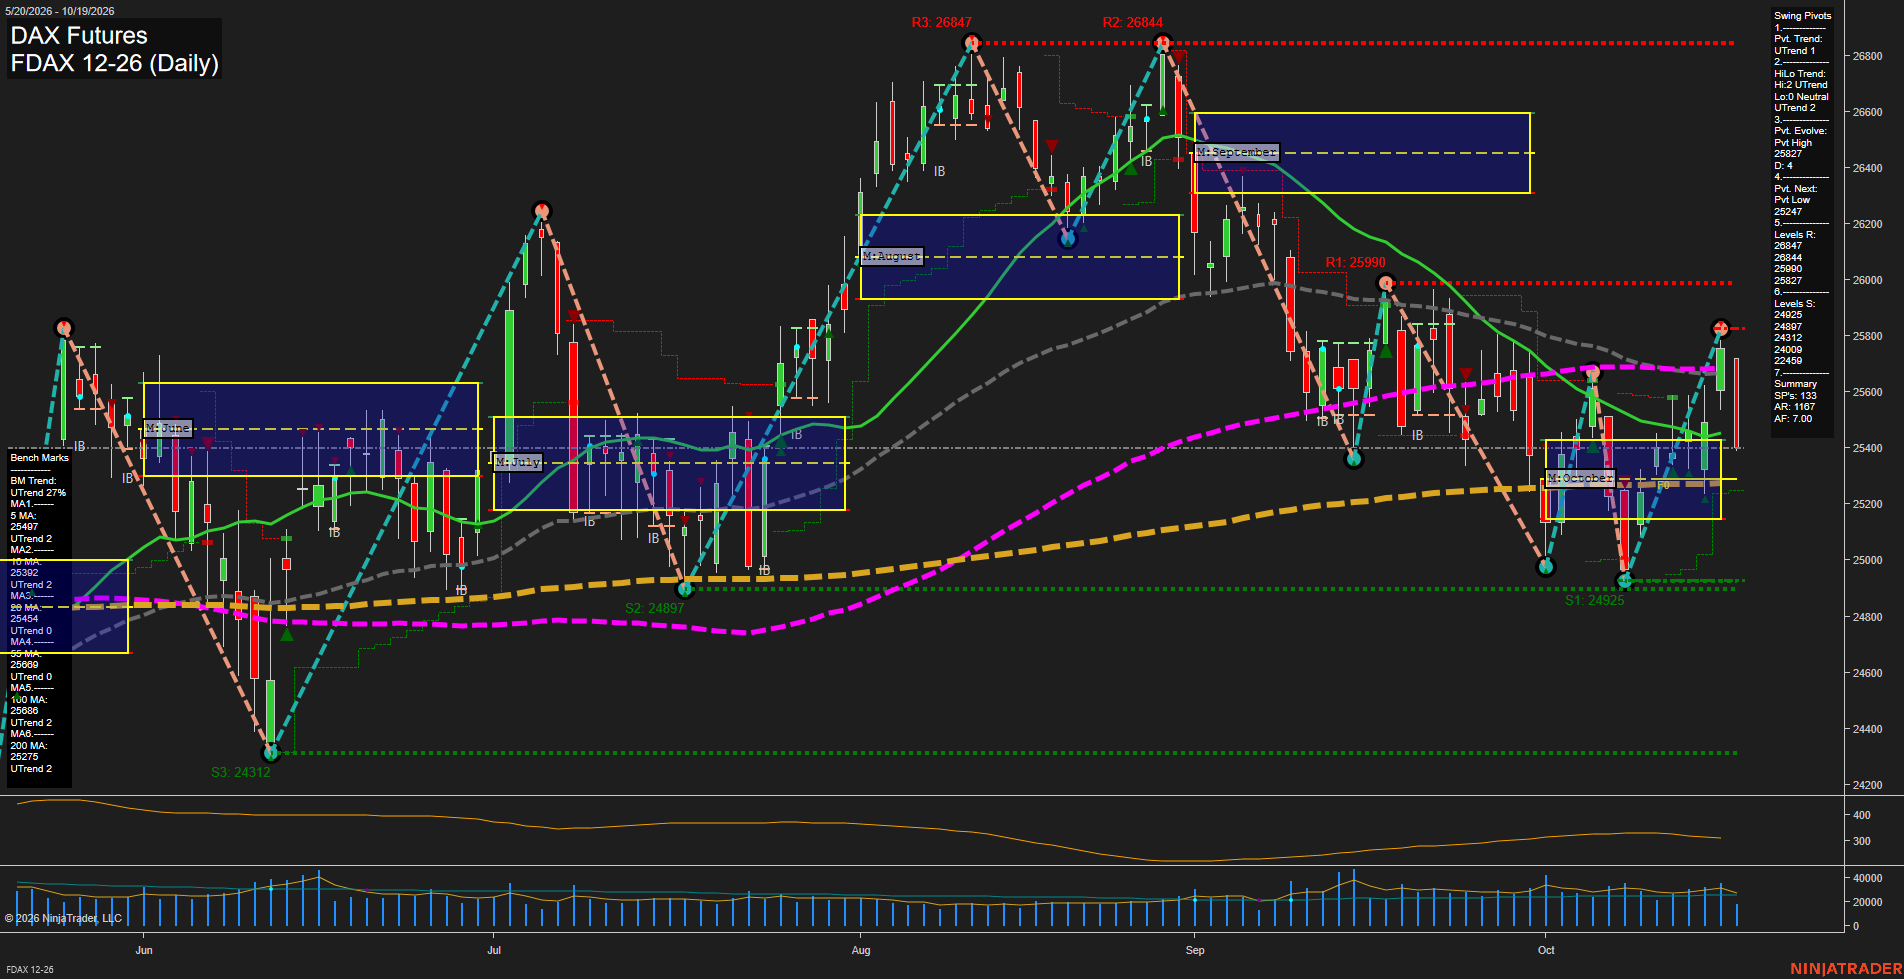
FDAX DAX Futures Daily Chart Analysis: 2026-Oct-19 07:04 CT
Price Action
- Last: 25401,
- Bars: Large,
- Mom: Fast.
WSFG Weekly
- Short-Term
- WSFG Current: -46%
- F0%/NTZ' Bias: Price Below,
- WSFG Trend: Down.
MSFG Month Oct
- Intermediate-Term
- MSFG Current: 17%
- F0%/NTZ' Bias: Price Above,
- MSFG Trend: Up.
YSFG Year 2026
- Long-Term
- YSFG Current: 9%
- F0%/NTZ' Bias: Price Above,
- YSFG Trend: Up.
Swing Pivots
- (Short-Term) 1. Pvt. Trend: UTrend,
- (Intermediate-Term) 2. HiLo Trend: UTrend,
- 3. Pvt. Evolve: Pvt high 25827,
- 4. Pvt. Next: Pvt low 25247,
- 5. Levels R: 26847, 26844, 25990, 25827,
- 6. Levels S: 24925, 24897, 24312.
Daily Benchmarks
- (Short-Term) 5 Day: 25497 Up Trend,
- (Short-Term) 10 Day: 25392 Up Trend,
- (Intermediate-Term) 20 Day: 25454 Up Trend,
- (Intermediate-Term) 55 Day: 25608 Up Trend,
- (Long-Term) 100 Day: 25686 Up Trend,
- (Long-Term) 200 Day: 25275 Up Trend.
Additional Metrics
Recent Trade Signals
- 19 Oct 2026: Short FDAX 12-26 @ 25458 Signals.USAR.TR120
- 19 Oct 2026: Short FDAX 12-26 @ 25628 Signals.USAR-WSFG
- 13 Oct 2026: Long FDAX 12-26 @ 25370 Signals.USAR-MSFG
Overall Rating
- Short-Term: Bearish,
- Intermediate-Term: Neutral,
- Long-Term: Bullish.
Key Insights Summary
FDAX is in a high-volatility October pullback following rejection from the 25827 pivot-high area. Short-term price action has turned sharply lower and is below the weekly fib center, while the most recent large red bar reflects fast downside momentum. The broader pivot structure remains UTrend and the monthly and yearly fib grids remain positive, but price is compressed between support near 25247 to 24925 and overhead benchmark resistance from 25454 through 25686. This creates a mixed intermediate-term consolidation within a still-positive long-term structure.
Chart Analysis ATS AI Generated: 2026-10-19 07:04 for Informational use only, not trading advice. Terms and Risk Disclosure Copyright © 2026. Algo Trading Systems LLC.