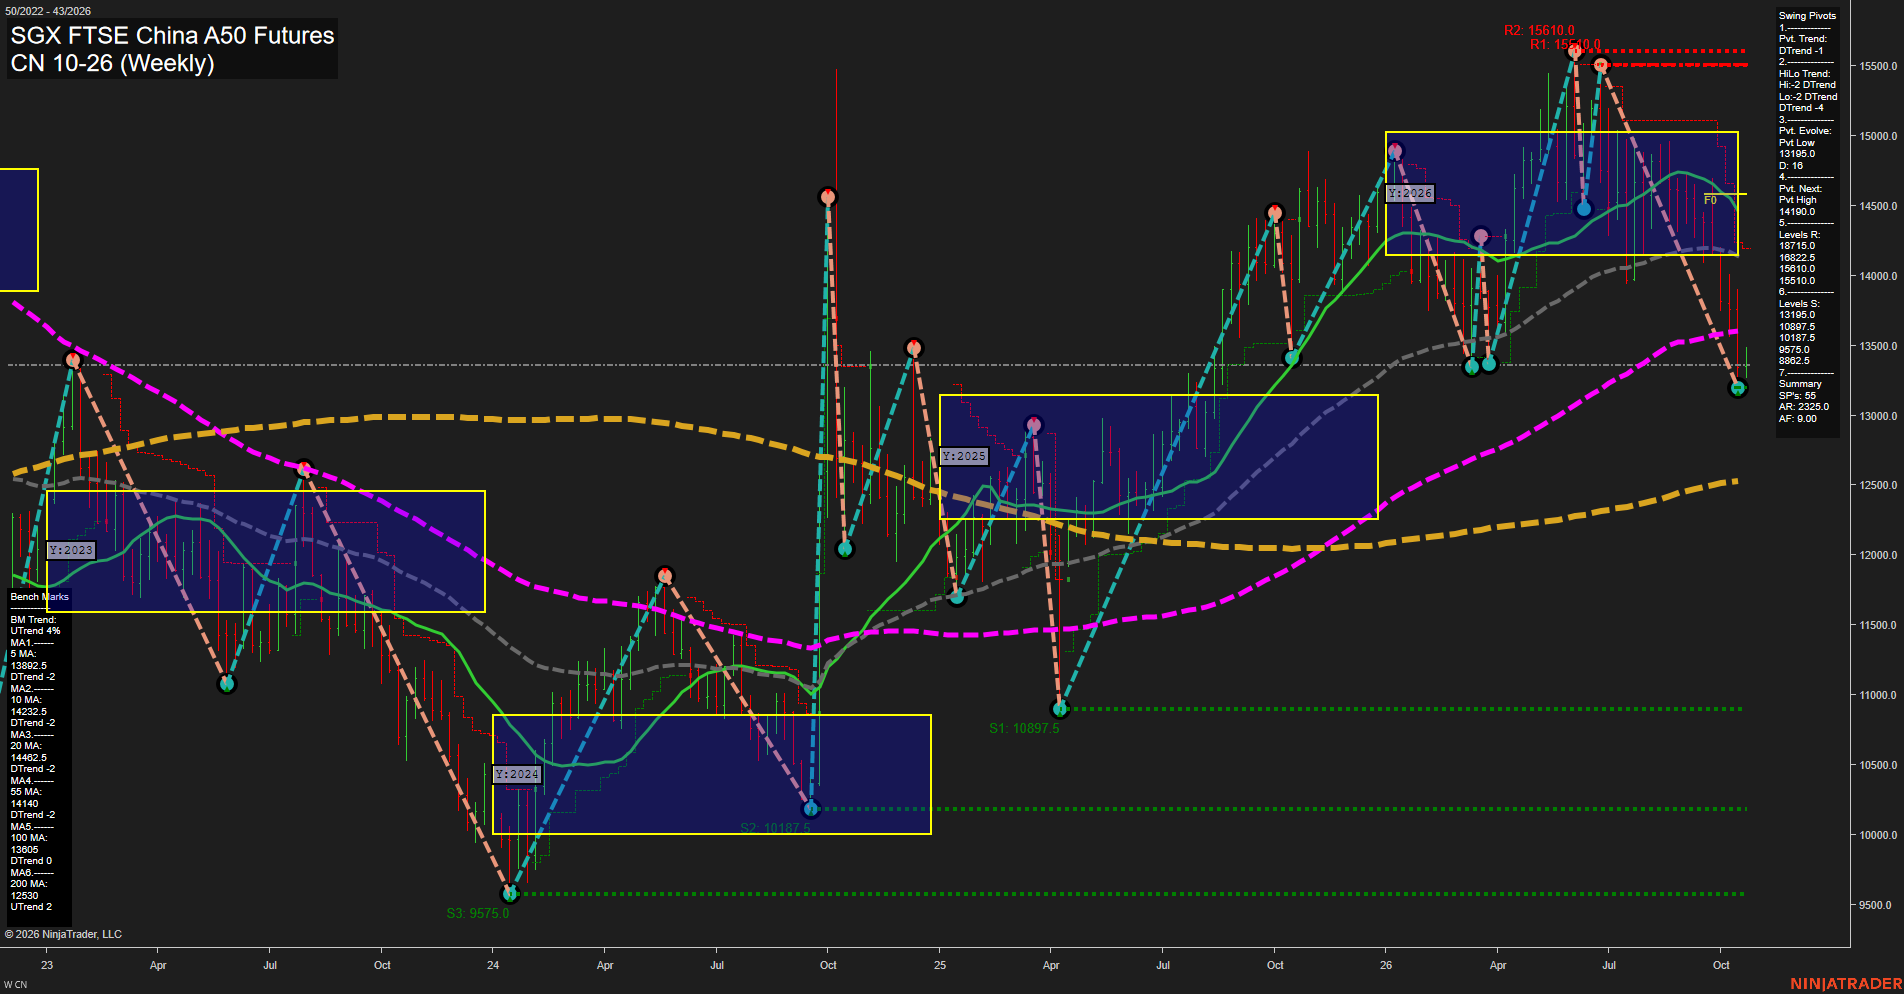
CN SGX FTSE China A50 Futures Weekly Chart Analysis: 2026-Oct-19 07:02 CT
Price Action
- Last: 13206.0,
- Bars: Large,
- Mom: fast.
WSFG Weekly
- Short-Term
- WSFG Current: NA%
- F0%/NTZ' Bias: Price Bearish,
- WSFG Trend: Bearish.
MSFG Month Oct
- Intermediate-Term
- MSFG Current: NA%
- F0%/NTZ' Bias: Price Bearish,
- MSFG Trend: Bearish.
YSFG Year 2026
- Long-Term
- YSFG Current: NA%
- F0%/NTZ' Bias: Price Bearish,
- YSFG Trend: Bearish.
Swing Pivots
- (Short-Term) 1. Pvt. Trend: DTrend,
- (Intermediate-Term) 2. HiLo Trend: DTrend,
- 3. Pvt. Evolve: Pvt low 13195.0,
- 4. Pvt. Next: Pvt high 14190.0,
- 5. Levels R: 18375.0, 16322.5, 15610.0,
- 6. Levels S: 13195.0, 10897.5, 10187.5, 9575.0, 8832.5.
Weekly Benchmarks
- (Short-Term) 5 Day: 13895.5 Down Trend,
- (Short-Term) 10 Day: 14232.5 Down Trend,
- (Intermediate-Term) 20 Day: 14402.5 Down Trend,
- (Intermediate-Term) 55 Day: 14140.0 Down Trend,
- (Long-Term) 100 Day: 13605.0 Down Trend,
- (Long-Term) 200 Day: 12530.0 Up Trend.
Overall Rating
- Short-Term: Bearish,
- Intermediate-Term: Bearish,
- Long-Term: Neutral.
Key Insights Summary
Price has undergone a fast, large weekly selloff from the 15510.0 pivot-high region and is now testing the active 13195.0 pivot-low support. Both the short-term pivot trend and intermediate HiLo structure are in DTrend, while price is below every benchmark from the 5 through 100 period averages. The 14190.0 reversal threshold is the next pivot-high level and defines the nearest structural recovery zone; the 13605.0 to 14402.5 benchmark cluster remains overhead resistance. Long-term structure is mixed because price remains above the rising 200-period benchmark at 12530.0, but the yearly Fib-grid position and the decline below the 100-period average reflect a material countertrend retracement.
Chart Analysis ATS AI Generated: 2026-10-19 07:03 for Informational use only, not trading advice. Terms and Risk Disclosure Copyright © 2026. Algo Trading Systems LLC.