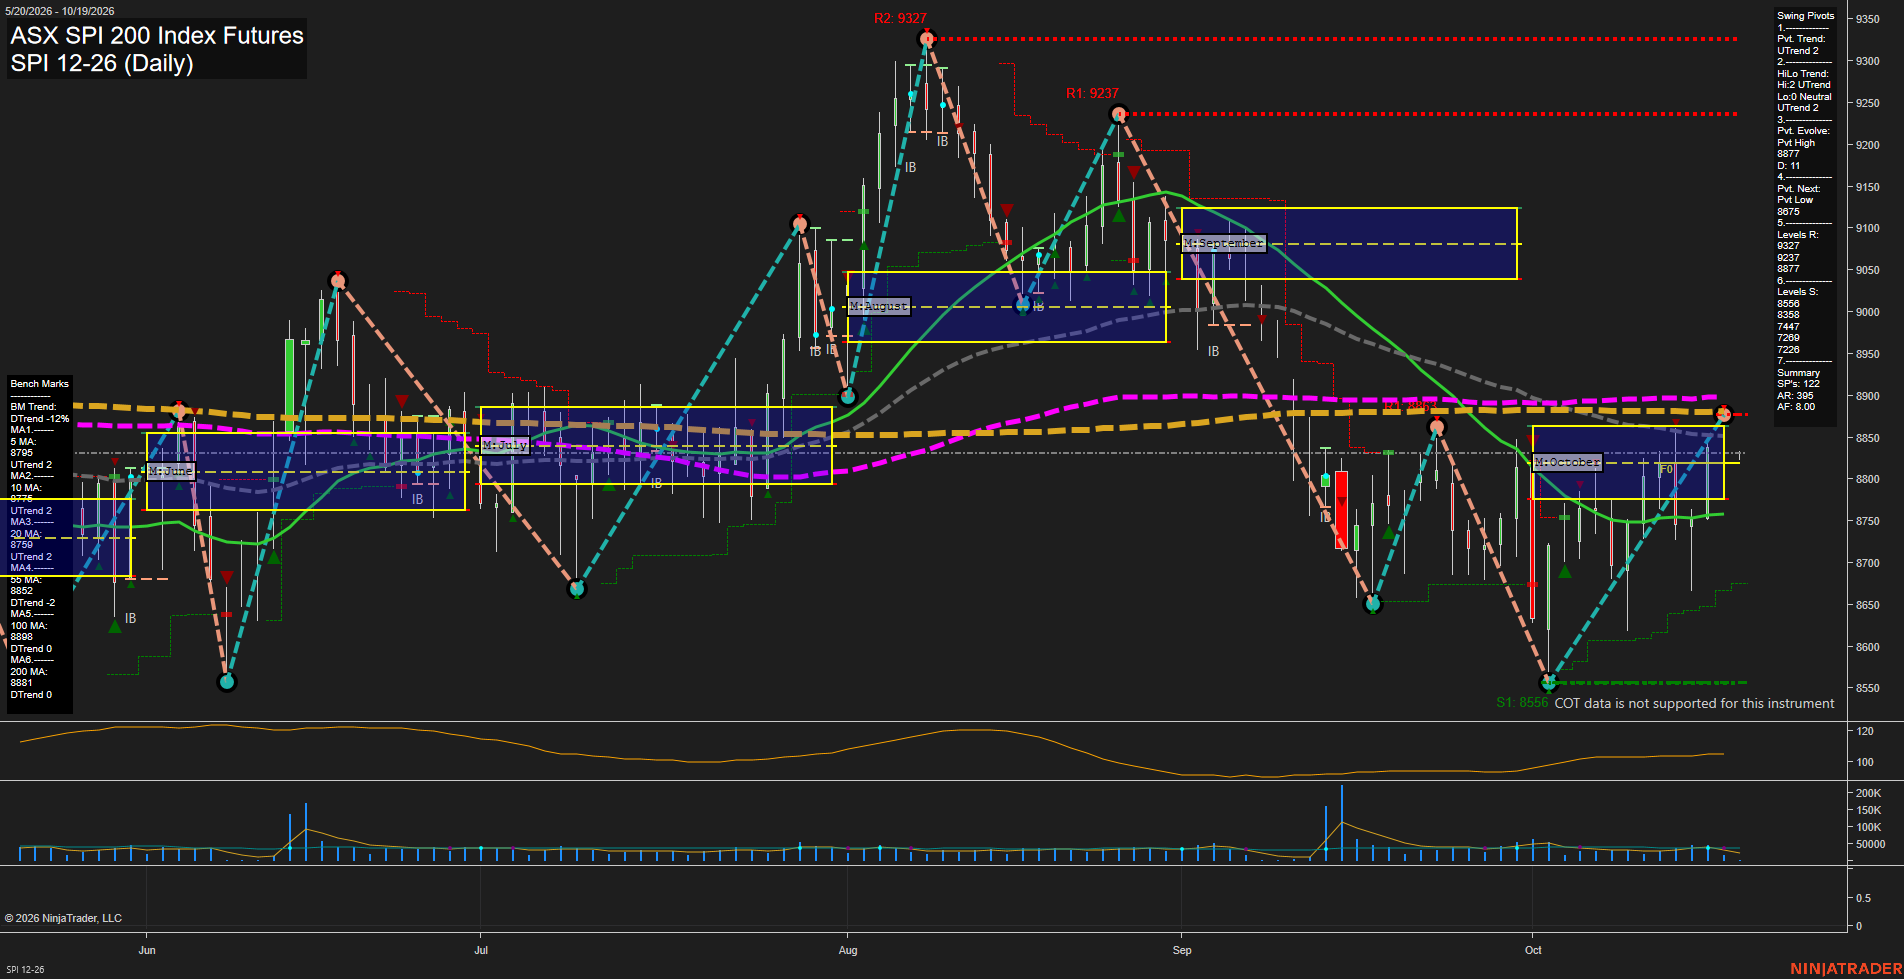
SPI ASX SPI 200 Index Futures Daily Chart Analysis: 2026-Oct-18 18:07 CT
Price Action
- Last: 8875,
- Bars: Medium,
- Mom: fast.
WSFG Weekly
- Short-Term
- WSFG Current: NA%
- F0%/NTZ' Bias: Price Neutral,
- WSFG Trend: Neutral.
MSFG Month Oct
- Intermediate-Term
- MSFG Current: NA%
- F0%/NTZ' Bias: Price Bullish,
- MSFG Trend: UTrend.
YSFG Year 2026
- Long-Term
- YSFG Current: NA%
- F0%/NTZ' Bias: Price Neutral,
- YSFG Trend: Neutral.
Swing Pivots
- (Short-Term) 1. Pvt. Trend: UTrend,
- (Intermediate-Term) 2. HiLo Trend: UTrend,
- 3. Pvt. Evolve: Pvt high 8875,
- 4. Pvt. Next: Pvt low 8675,
- 5. Levels R: 9327, 9237, 8877,
- 6. Levels S: 8556, 8356, 7447, 7269, 7226.
Daily Benchmarks
- (Short-Term) 5 Day: 8795 Up Trend,
- (Short-Term) 10 Day: 8875 Up Trend,
- (Intermediate-Term) 20 Day: 8759 Up Trend,
- (Intermediate-Term) 55 Day: 8852 Down Trend,
- (Long-Term) 100 Day: 8898 Down Trend,
- (Long-Term) 200 Day: 8811 Down Trend.
Additional Metrics
Overall Rating
- Short-Term: Bullish,
- Intermediate-Term: Neutral,
- Long-Term: Neutral.
Key Insights Summary
Price has produced a sharp V-shaped recovery from the 8556 swing-low support and has rebuilt a short-term UTrend, with price above the rising 5-day and 20-day benchmarks. The rebound has reached the 8875 to 8877 pivot-resistance area and is testing the declining 55-day and 100-day averages near 8852 to 8898, creating an important overhead confluence zone. Intermediate structure remains constructive through higher pivot lows, but the longer benchmark alignment remains mixed because the 55-day, 100-day, and 200-day trend readings are still down. The recent advance carries fast momentum and medium-sized daily bars, while ATR near 103 indicates an active volatility environment. A sustained move above the nearby resistance cluster would extend the recovery toward 9237, whereas rejection would keep the market rotating within the broad 8556 to 8898 range.
Chart Analysis ATS AI Generated: 2026-10-18 18:07 for Informational use only, not trading advice. Terms and Risk Disclosure Copyright © 2026. Algo Trading Systems LLC.