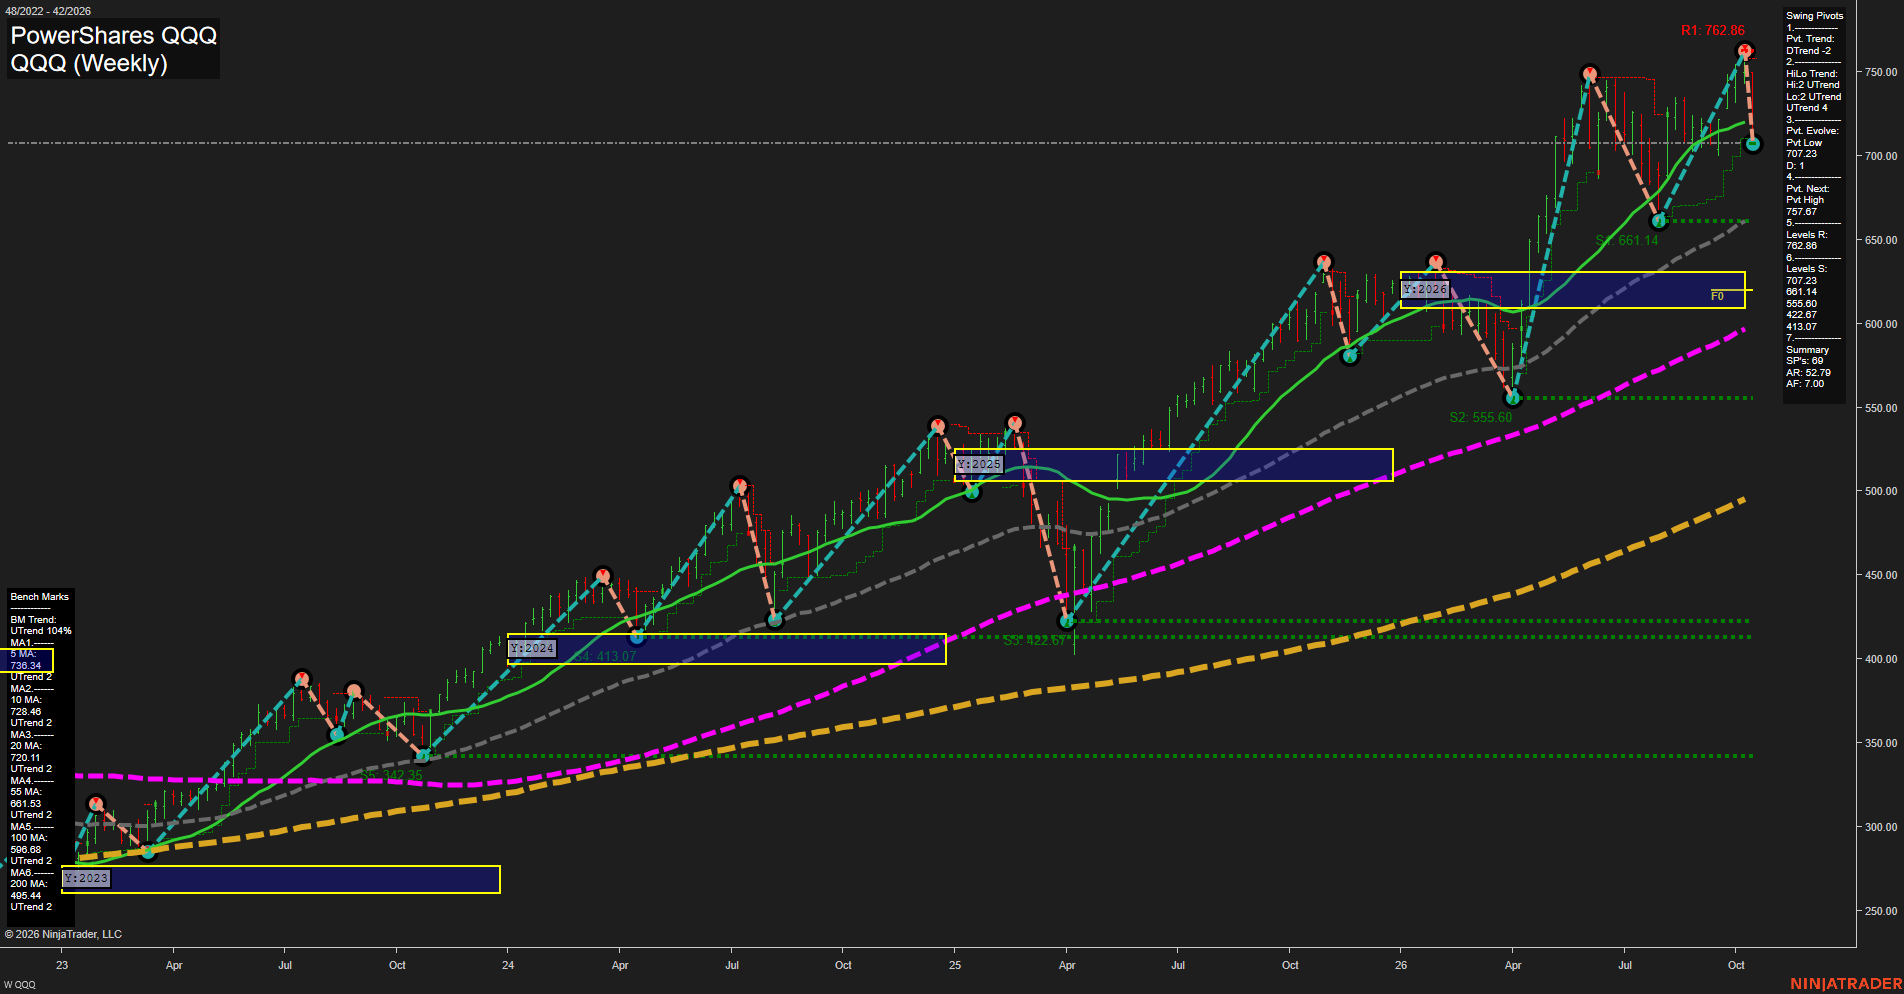
QQQ PowerShares QQQ Weekly Chart Analysis: 2026-Oct-18 18:06 CT
Price Action
- Last: 707.23,
- Bars: Large,
- Mom: fast.
WSFG Weekly
- Short-Term
- WSFG Current: NA%
- F0%/NTZ' Bias: Price Above NTZ,
- WSFG Trend: UTrend.
MSFG Month Oct
- Intermediate-Term
- MSFG Current: NA%
- F0%/NTZ' Bias: Price Above NTZ,
- MSFG Trend: UTrend.
YSFG Year 2026
- Long-Term
- YSFG Current: NA%
- F0%/NTZ' Bias: Price Above NTZ,
- YSFG Trend: UTrend.
Swing Pivots
- (Short-Term) 1. Pvt. Trend: DTrend,
- (Intermediate-Term) 2. HiLo Trend: UTrend,
- 3. Pvt. Evolve: Pvt low 707.23,
- 4. Pvt. Next: Pvt high 757.87,
- 5. Levels R: 762.86,
- 6. Levels S: 661.14, 555.60, 422.67, 413.07.
Weekly Benchmarks
- (Short-Term) 5 Day: 736.84 Up Trend,
- (Short-Term) 10 Day: 728.48 Up Trend,
- (Intermediate-Term) 20 Day: 720.11 Up Trend,
- (Intermediate-Term) 55 Day: 681.53 Up Trend,
- (Long-Term) 100 Day: 596.68 Up Trend,
- (Long-Term) 200 Day: 495.44 Up Trend.
Overall Rating
- Short-Term: Bearish,
- Intermediate-Term: Bullish,
- Long-Term: Bullish.
Key Insights Summary
QQQ, a proxy for Nasdaq futures swing conditions, remains in a broad higher-high and higher-low structure, with price above the rising 55, 100, and 200 period benchmarks. The latest large weekly decline from the 762.86 resistance pivot has shifted the short-term pivot condition to DTrend and placed price below the 5, 10, and 20 period benchmarks. The 707.23 pivot low is the immediate downside reference, while 757.87 to 762.86 defines the overhead swing-resistance zone. Intermediate and long-term structure remains constructive because the HiLo trend and all major benchmark trends remain positive, with 661.14 representing the next prominent support area beneath the current pullback.
Chart Analysis ATS AI Generated: 2026-10-18 18:06 for Informational use only, not trading advice. Terms and Risk Disclosure Copyright © 2026. Algo Trading Systems LLC.