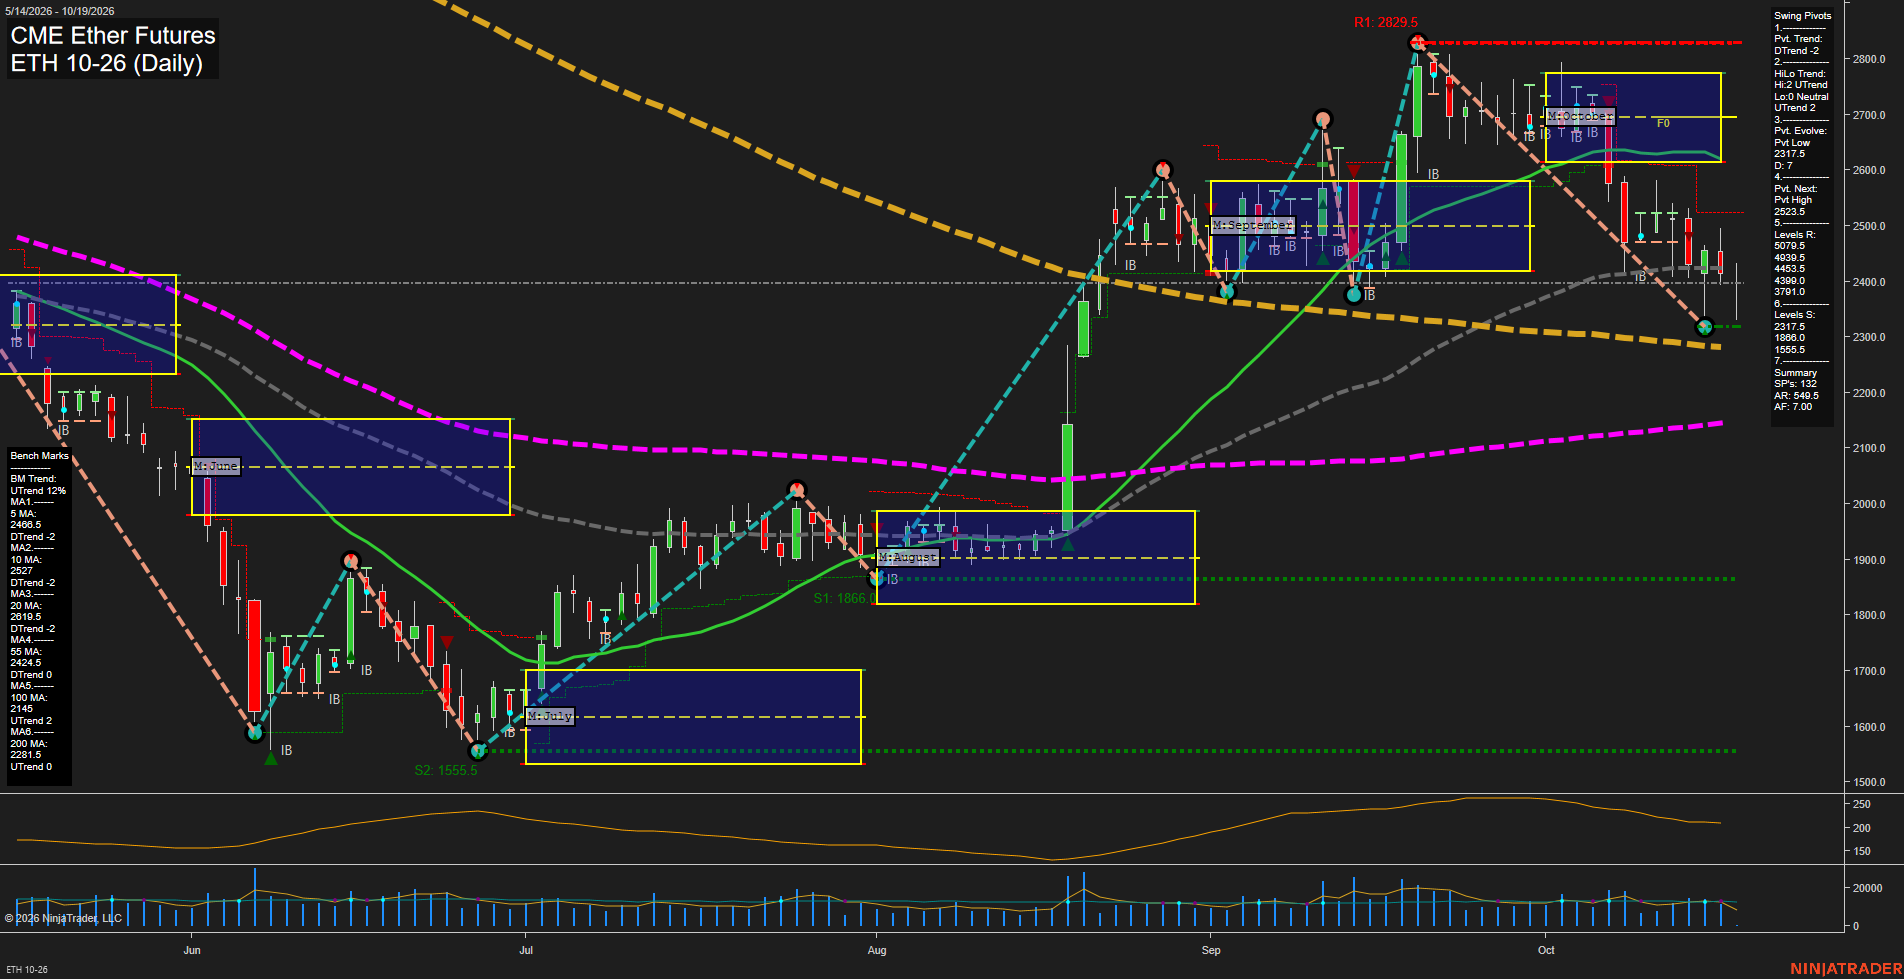
ETH CME Ether Futures Daily Chart Analysis: 2026-Oct-18 18:03 CT
Price Action
- Last: 2400.0,
- Bars: Small,
- Mom: slow.
WSFG Weekly
- Short-Term
- WSFG Current: -7%
- F0%/NTZ' Bias: Price Below,
- WSFG Trend: Down.
MSFG Month Oct
- Intermediate-Term
- MSFG Current: -55%
- F0%/NTZ' Bias: Price Below,
- MSFG Trend: Down.
YSFG Year 2026
- Long-Term
- YSFG Current: -26%
- F0%/NTZ' Bias: Price Below,
- YSFG Trend: Down.
Swing Pivots
- (Short-Term) 1. Pvt. Trend: DTrend,
- (Intermediate-Term) 2. HiLo Trend: UTrend,
- 3. Pvt. Evolve: Pvt low 2317.5,
- 4. Pvt. Next: Pvt high 2523.5,
- 5. Levels R: 5079.5, 4939.5, 4453.5, 4390.0, 3791.0,
- 6. Levels S: 2317.5, 1866.0, 1555.5.
Daily Benchmarks
- (Short-Term) 5 Day: 2468.5 Down Trend,
- (Short-Term) 10 Day: 2527.0 Down Trend,
- (Intermediate-Term) 20 Day: 2619.5 Down Trend,
- (Intermediate-Term) 55 Day: 2424.5 Down Trend,
- (Long-Term) 100 Day: 2145.0 Up Trend,
- (Long-Term) 200 Day: 2281.5 Up Trend.
Additional Metrics
Recent Trade Signals
- 15 Oct 2026: Long ETH 10-26 @ 2446.5 Signals.USAR.TR120
- 14 Oct 2026: Short ETH 10-26 @ 2477.5 Signals.USAR-WSFG
Overall Rating
- Short-Term: Bearish,
- Intermediate-Term: Bearish,
- Long-Term: Neutral.
Key Insights Summary
ETH futures remain in a short-term corrective downswing following rejection from the late-September/early-October highs near 2800. Price is beneath the declining 5, 10, 20, and 55-day benchmarks, while the weekly and monthly Fib-grid readings remain below F0%, confirming downside pressure across the active swing horizons. Small daily bars and slowing momentum indicate consolidation near 2400 after the selloff. The 2317.5 pivot low is the immediate structural support, while 2523.5 is the next pivot reversal threshold and aligns with nearby moving-average overhead. The intermediate HiLo structure remains upward because the broader advance from the summer low has not been fully negated, and price remains above rising 100- and 200-day averages; however, the negative monthly and yearly grid positioning leaves the longer-term condition mixed rather than decisively bullish.
Chart Analysis ATS AI Generated: 2026-10-18 18:03 for Informational use only, not trading advice. Terms and Risk Disclosure Copyright © 2026. Algo Trading Systems LLC.