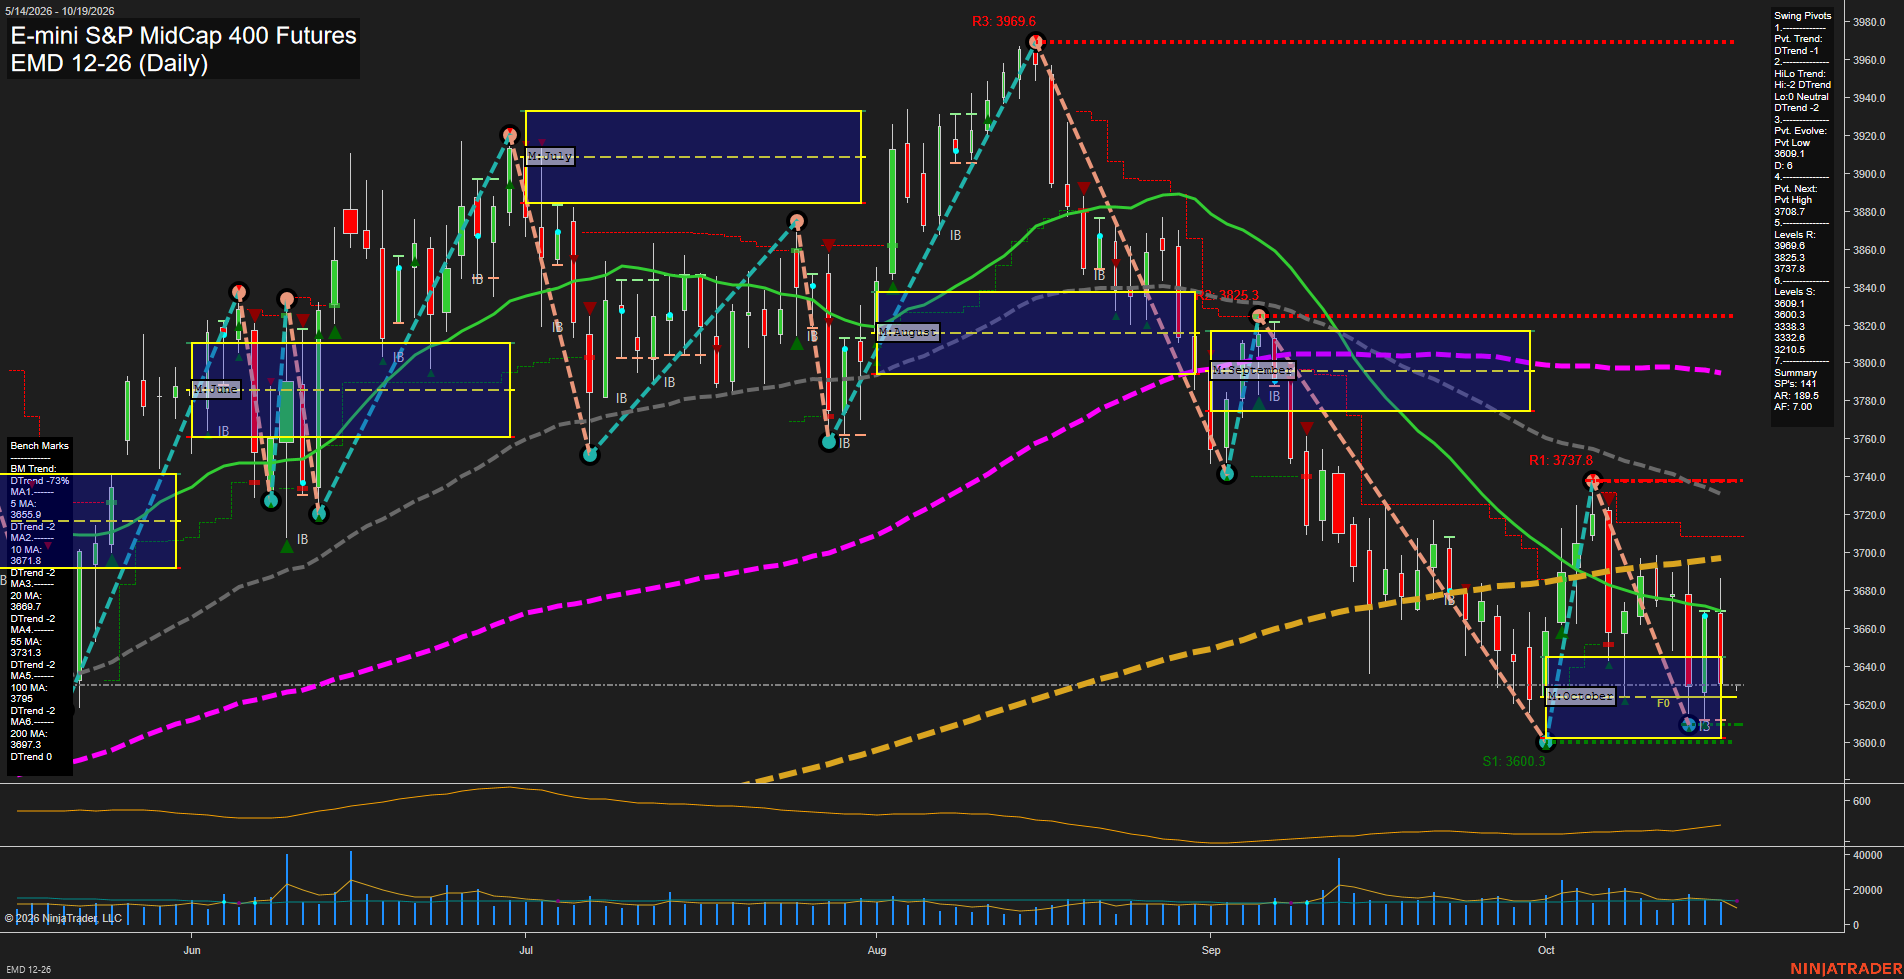
EMD E-mini S&P MidCap 400 Futures Daily Chart Analysis: 2026-Oct-18 18:02 CT
Price Action
- Last: 3626.5,
- Bars: Medium,
- Mom: Fast.
WSFG Weekly
- Short-Term
- WSFG Current: -77%
- F0%/NTZ' Bias: Price Below,
- WSFG Trend: Down.
MSFG Month Oct
- Intermediate-Term
- MSFG Current: -1%
- F0%/NTZ' Bias: Price Below,
- MSFG Trend: Down.
YSFG Year 2026
- Long-Term
- YSFG Current: 25%
- F0%/NTZ' Bias: Price Above,
- YSFG Trend: Up.
Swing Pivots
- (Short-Term) 1. Pvt. Trend: DTrend,
- (Intermediate-Term) 2. HiLo Trend: DTrend,
- 3. Pvt. Evolve: Pvt low 3600.3,
- 4. Pvt. Next: Pvt high 3708.7,
- 5. Levels R: 3969.6, 3825.3, 3737.8,
- 6. Levels S: 3600.3, 3338.3, 3322.6, 3216.3.
Daily Benchmarks
- (Short-Term) 5 Day: 3655.9 Down Trend,
- (Short-Term) 10 Day: 3671.8 Down Trend,
- (Intermediate-Term) 20 Day: 3680.7 Down Trend,
- (Intermediate-Term) 55 Day: 3731.3 Down Trend,
- (Long-Term) 100 Day: 3795.3 Down Trend,
- (Long-Term) 200 Day: 3697.3 Down Trend.
Additional Metrics
Recent Trade Signals
- 16 Oct 2026: Short EMD 12-26 @ 3626.5 Signals.USAR.TR120
- 15 Oct 2026: Long EMD 12-26 @ 3654.7 Signals.USAR-MSFG
- 13 Oct 2026: Short EMD 12-26 @ 3678.4 Signals.USAR-WSFG
Overall Rating
- Short-Term: Bearish,
- Intermediate-Term: Bearish,
- Long-Term: Neutral.
Key Insights Summary
Price remains beneath every daily benchmark, with the 5-day through 200-day averages aligned above the market and trending lower. The pivot structure is bearish across both short and intermediate horizons, defined by lower highs and lower lows following the September peak. The October decline tested the 3600.3 pivot-low support, then produced a sharp rebound toward 3737.8 that was rejected, returning price below the short-term averages. Weekly and monthly fib-grid positioning remains below F0%, reinforcing the active downside swing, while the yearly grid remains positive and creates a longer-term countertrend backdrop. Volatility is elevated relative to recent bar behavior, and the 3600.3 support, 3708.7 pivot-reversal threshold, and 3737.8 resistance mark the principal current swing boundaries.
Chart Analysis ATS AI Generated: 2026-10-18 18:03 for Informational use only, not trading advice. Terms and Risk Disclosure Copyright © 2026. Algo Trading Systems LLC.