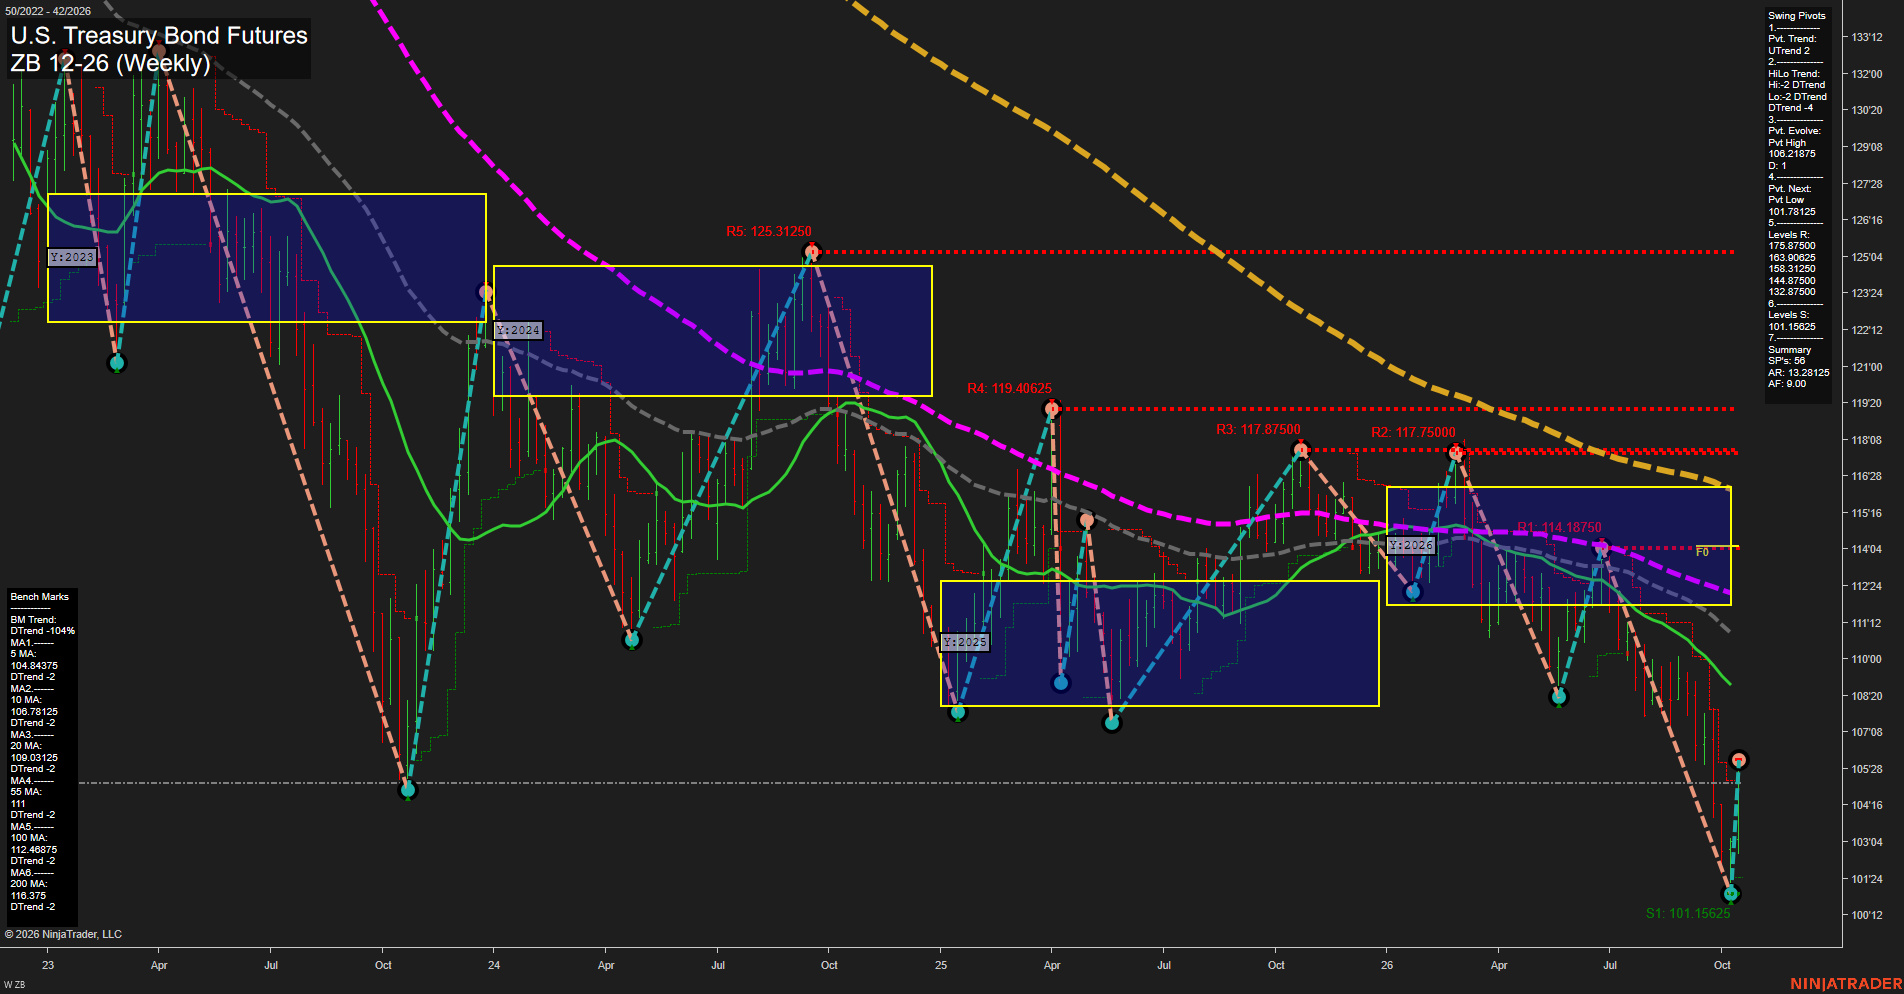
ZB U.S. Treasury Bond Futures Weekly Chart Analysis: 2026-Oct-16 07:12 CT
Price Action
- Last: 105'28,
- Bars: Large,
- Mom: fast.
WSFG Weekly
- Short-Term
- WSFG Current: 75%
- F0%/NTZ' Bias: Price Above,
- WSFG Trend: Up.
MSFG Month Oct
- Intermediate-Term
- MSFG Current: 57%
- F0%/NTZ' Bias: Price Above,
- MSFG Trend: Up.
YSFG Year 2026
- Long-Term
- YSFG Current: -41%
- F0%/NTZ' Bias: Price Below,
- YSFG Trend: Down.
Swing Pivots
- (Short-Term) 1. Pvt. Trend: UTrend,
- (Intermediate-Term) 2. HiLo Trend: DTrend,
- 3. Pvt. Evolve: Pvt high 106'02,
- 4. Pvt. Next: Pvt low 101'25,
- 5. Levels R: 175'28, 163'29, 158'10, 144'28, 132'28,
- 6. Levels S: 101'05.
Weekly Benchmarks
- (Short-Term) 5 Day: 104'11 Down Trend,
- (Short-Term) 10 Day: 106'25 Down Trend,
- (Intermediate-Term) 20 Day: 109'01 Down Trend,
- (Intermediate-Term) 55 Day: 111'00 Down Trend,
- (Long-Term) 100 Day: 112'15 Down Trend,
- (Long-Term) 200 Day: 116'12 Down Trend.
Overall Rating
- Short-Term: Bullish,
- Intermediate-Term: Bearish,
- Long-Term: Bearish.
Key Insights Summary
The weekly chart shows a sharp, fast-momentum rebound from the 101'05 support area, producing a short-term UTrend pivot structure and an upward weekly fib-grid condition. This recovery remains countertrend within the broader weekly structure: the intermediate HiLo trend is down, price remains below the yearly F0%/NTZ area, and all displayed benchmark averages retain Down Trend readings. The current rally has lifted price above the 5-period benchmark but remains below the 10, 20, 55, 100, and 200-period benchmarks, defining 106'25 through 116'12 as layered overhead technical pressure. The 101'05 pivot low remains the dominant downside reference, while 106'02 is the immediate pivot-evolution level separating the current rebound from a renewed short-term downswing.
Chart Analysis ATS AI Generated: 2026-10-16 07:12 for Informational use only, not trading advice. Terms and Risk Disclosure Copyright © 2026. Algo Trading Systems LLC.