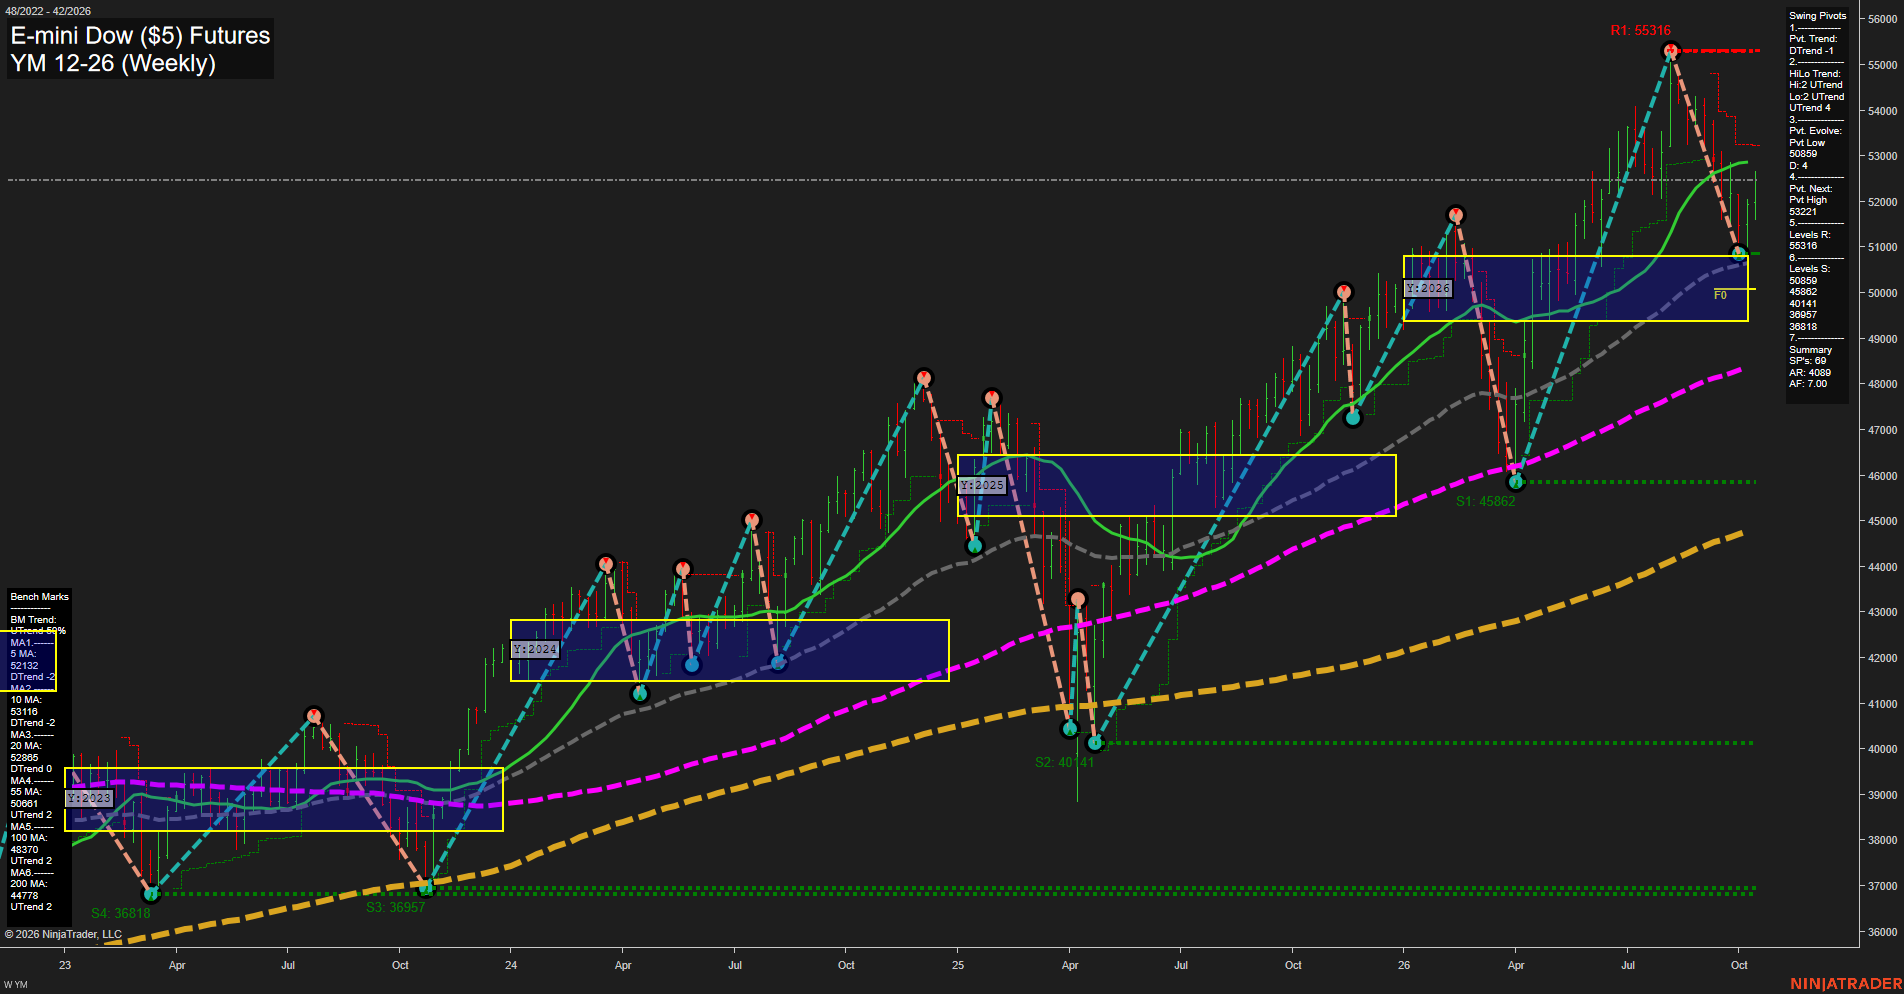
YM E-mini Dow ($5) Futures Weekly Chart Analysis: 2026-Oct-16 07:11 CT
Price Action
- Last: 52202,
- Bars: Large,
- Mom: Fast.
WSFG Weekly
- Short-Term
- WSFG Current: 38%
- F0%/NTZ' Bias: Price Above,
- WSFG Trend: Up.
MSFG Month Oct
- Intermediate-Term
- MSFG Current: 50%
- F0%/NTZ' Bias: Price Above,
- MSFG Trend: Up.
YSFG Year 2026
- Long-Term
- YSFG Current: 33%
- F0%/NTZ' Bias: Price Above,
- YSFG Trend: Up.
Swing Pivots
- (Short-Term) 1. Pvt. Trend: DTrend,
- (Intermediate-Term) 2. HiLo Trend: UTrend,
- 3. Pvt. Evolve: Pvt low 50859,
- 4. Pvt. Next: Pvt high 53221,
- 5. Levels R: 55316,
- 6. Levels S: 50859, 45862, 40141, 36957, 36818.
Weekly Benchmarks
- (Short-Term) 5 Day: 52133 Down Trend,
- (Short-Term) 10 Day: 53116 Down Trend,
- (Intermediate-Term) 20 Day: 52885 Down Trend,
- (Intermediate-Term) 55 Day: 50681 Up Trend,
- (Long-Term) 100 Day: 48370 Up Trend,
- (Long-Term) 200 Day: 44772 Up Trend.
Recent Trade Signals
- 16 Oct 2026: Long YM 12-26 @ 52529 Signals.USAR.TR720
- 15 Oct 2026: Long YM 12-26 @ 52401 Signals.USAR.TR120
- 15 Oct 2026: Long YM 12-26 @ 52103 Signals.USAR-WSFG
- 09 Oct 2026: Long YM 12-26 @ 51639 Signals.USAR-MSFG
Overall Rating
- Short-Term: Bullish,
- Intermediate-Term: Bullish,
- Long-Term: Bullish.
Key Insights Summary
YM remains structurally bullish across the weekly, monthly, and yearly fib-grid frameworks, with price holding above the respective F0% references and above the rising 55-, 100-, and 200-period benchmarks. The recent decline from the 55316 pivot high established a short-term DTrend and left the 5-, 10-, and 20-period averages softer, but the rebound from the 50859 pivot low shows a sharp countertrend recovery within the broader higher-high and higher-low structure. The 53221 next-pivot threshold defines the nearby swing inflection, while 55316 remains the major overhead pivot resistance. The 50859 level is the nearest pivotal support, followed by the much deeper 45862 support zone. Recent long-direction signals across short-, intermediate-, and long-term models align with the prevailing broader uptrend, although the large weekly ranges reflect elevated volatility and a market still working through the prior pullback.
Chart Analysis ATS AI Generated: 2026-10-16 07:11 for Informational use only, not trading advice. Terms and Risk Disclosure Copyright © 2026. Algo Trading Systems LLC.