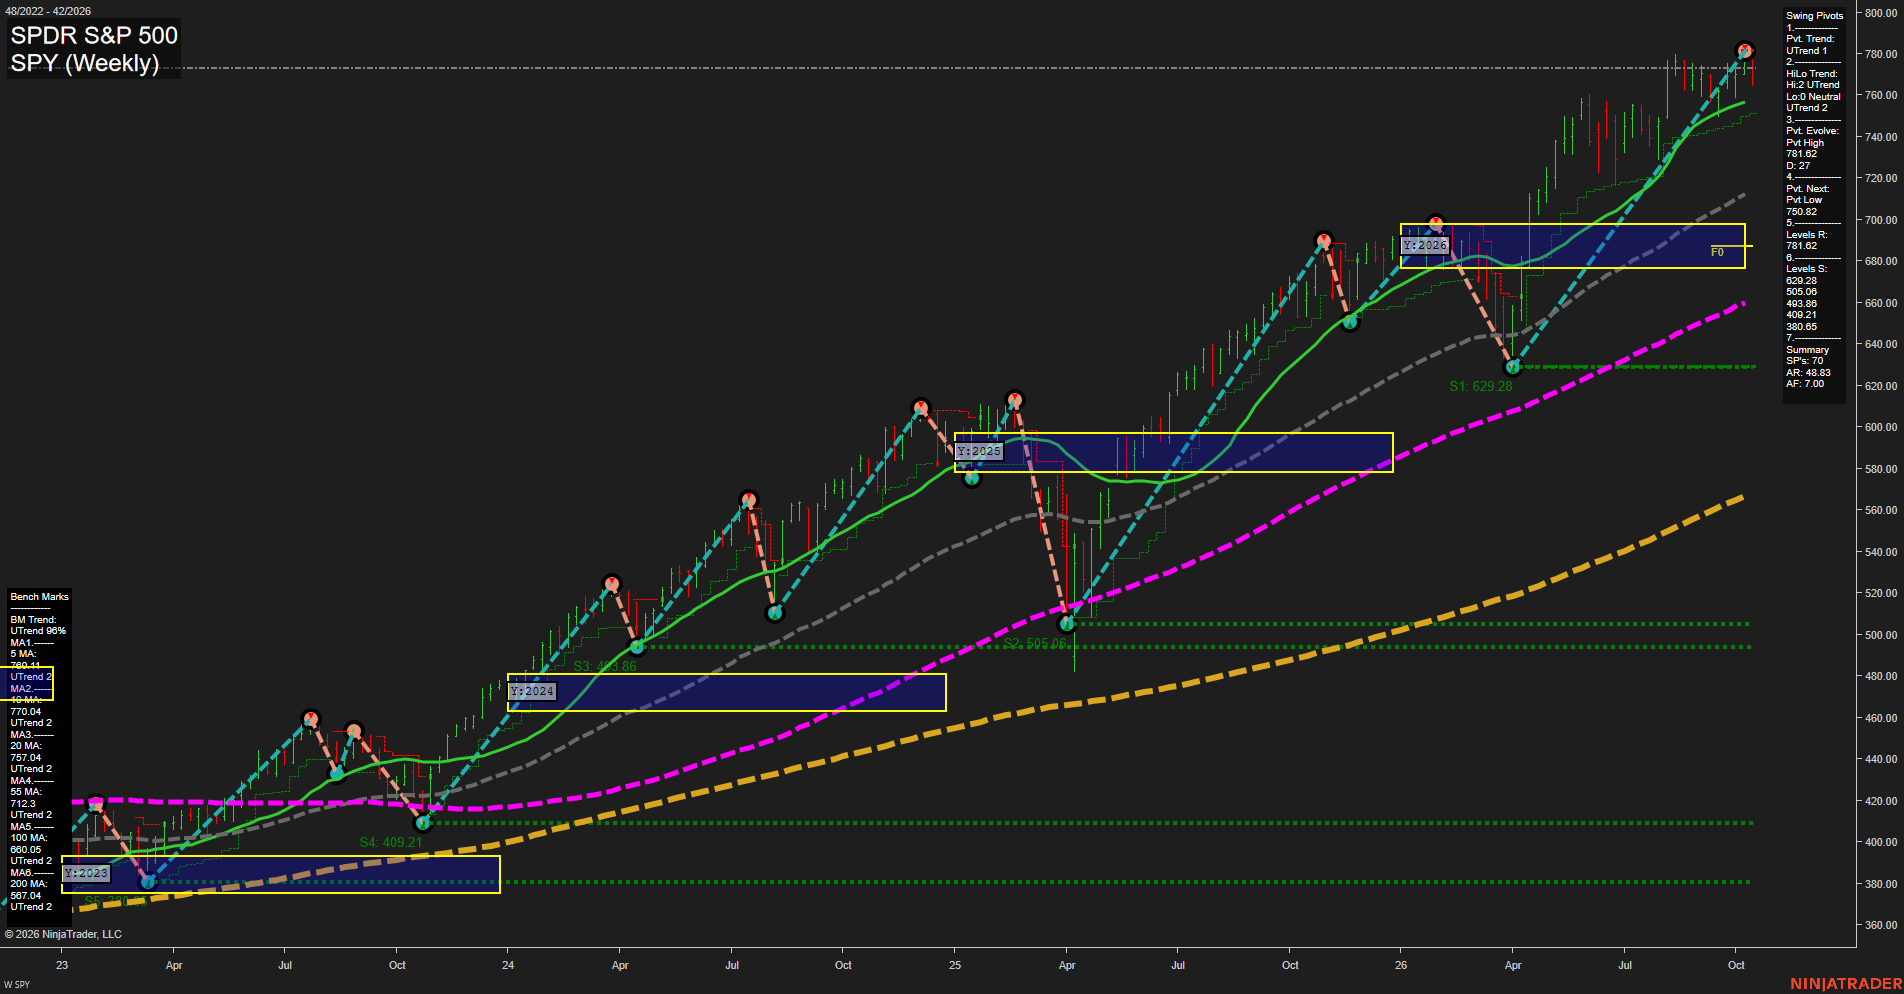
SPY SPDR S&P 500 Weekly Chart Analysis: 2026-Oct-16 07:10 CT
Price Action
- Last: 778.00,
- Bars: Small,
- Mom: Fast.
WSFG Weekly
- Short-Term
- WSFG Current: NA%
- F0%/NTZ' Bias: Price Bullish,
- WSFG Trend: Bullish.
MSFG Month Oct
- Intermediate-Term
- MSFG Current: NA%
- F0%/NTZ' Bias: Price Bullish,
- MSFG Trend: Bullish.
YSFG Year 2026
- Long-Term
- YSFG Current: NA%
- F0%/NTZ' Bias: Price Bullish,
- YSFG Trend: Bullish.
Swing Pivots
- (Short-Term) 1. Pvt. Trend: UTrend,
- (Intermediate-Term) 2. HiLo Trend: UTrend,
- 3. Pvt. Evolve: Pvt high 781.62,
- 4. Pvt. Next: Pvt low 750.82,
- 5. Levels R: 781.62,
- 6. Levels S: 689.28, 650.06, 493.86, 409.21, 380.65.
Weekly Benchmarks
- (Short-Term) 5 Day: 780.41 Up Trend,
- (Short-Term) 10 Day: 770.04 Up Trend,
- (Intermediate-Term) 20 Day: 757.04 Up Trend,
- (Intermediate-Term) 55 Day: 712.30 Up Trend,
- (Long-Term) 100 Day: 660.05 Up Trend,
- (Long-Term) 200 Day: 587.04 Up Trend.
Overall Rating
- Short-Term: Bullish,
- Intermediate-Term: Bullish,
- Long-Term: Bullish.
Key Insights Summary
The weekly index structure remains broadly constructive from a futures swing-trader perspective: price is near the 781.62 pivot-high resistance area, while the pivot and HiLo trends both show UTrend. The advance is extended above the rising 20-, 55-, 100-, and 200-period benchmarks, with 750.82 defining the nearest pivot-reversal reference. The 2026 yearly NTZ/F0% area near 680-700 has transitioned into a deeply underlying support zone, while 689.28 and 650.06 are the principal lower swing supports. Small weekly bars near the highs indicate consolidation beneath resistance rather than a broad weekly breakdown, although momentum remains fast after a sustained higher-high, higher-low advance.
Chart Analysis ATS AI Generated: 2026-10-16 07:10 for Informational use only, not trading advice. Terms and Risk Disclosure Copyright © 2026. Algo Trading Systems LLC.