SPI ASX SPI 200 Index Futures Weekly Chart Analysis: 2026-Oct-15 07:09 CT
Price Action
- Last: 8803,
- Bars: Large,
- Mom: Fast.
WSFG Weekly
- Short-Term
- WSFG Current: NA%
- F0%/NTZ' Bias: Price Neutral,
- WSFG Trend: Neutral.
MSFG Month Oct
- Intermediate-Term
- MSFG Current: NA%
- F0%/NTZ' Bias: Price Neutral,
- MSFG Trend: Neutral.
YSFG Year 2026
- Long-Term
- YSFG Current: NA%
- F0%/NTZ' Bias: Price Neutral,
- YSFG Trend: Neutral.
Swing Pivots
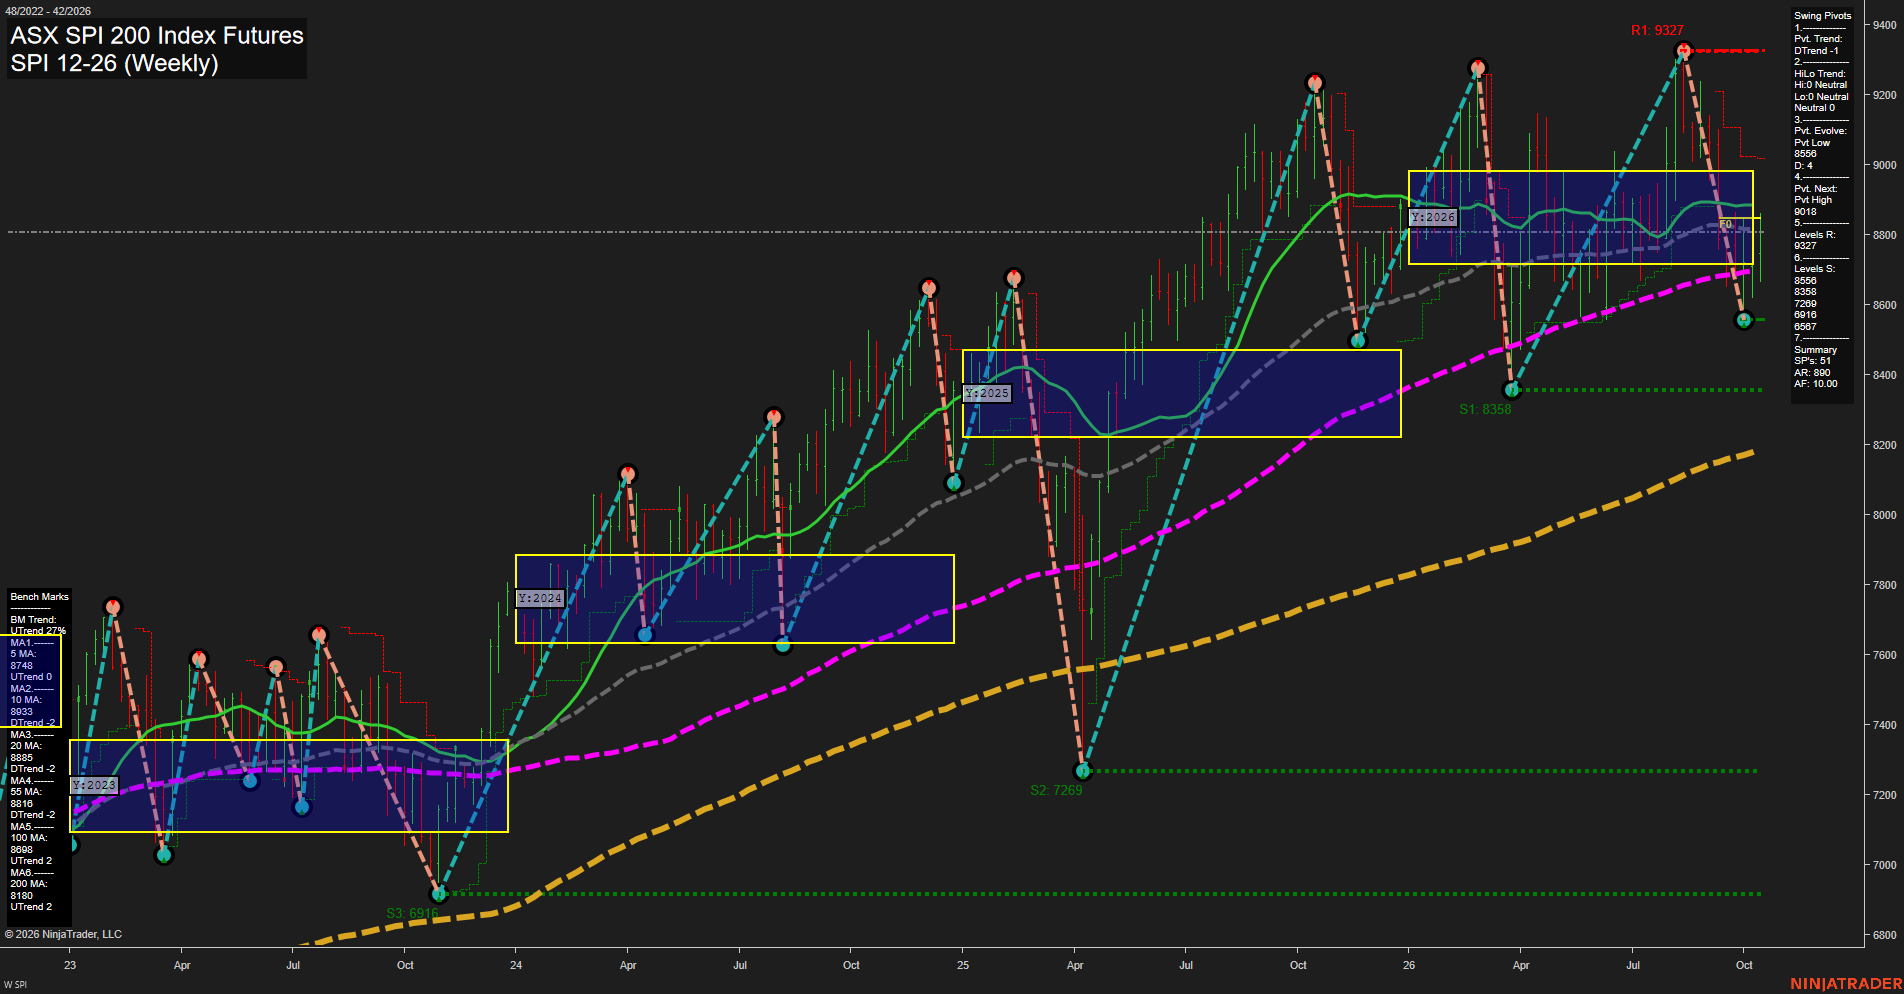
- (Short-Term) 1. Pvt. Trend: DTrend,
- (Intermediate-Term) 2. HiLo Trend: DTrend,
- 3. Pvt. Evolve: Pvt low 8556,
- 4. Pvt. Next: Pvt high 9013,
- 5. Levels R: 9327,
- 6. Levels S: 8556, 8358, 7269, 6916.
Weekly Benchmarks
- (Short-Term) 5 Day: 8748 Up Trend,
- (Short-Term) 10 Day: 8933 Down Trend,
- (Intermediate-Term) 20 Day: 8885 Down Trend,
- (Intermediate-Term) 55 Day: 8816 Down Trend,
- (Long-Term) 100 Day: 8698 Up Trend,
- (Long-Term) 200 Day: 8180 Up Trend.
Overall Rating
- Short-Term: Bearish,
- Intermediate-Term: Neutral,
- Long-Term: Bullish.
Key Insights Summary
SPI has produced a sharp decline from the 9327 pivot high into the 8556 swing-low area, followed by a fast rebound toward 8803. The short-term pivot structure remains in a DTrend, with 9013 defining the next upside reversal threshold. Price is caught around the 20-week and 55-week benchmarks, which remain declining, while the rising 100-week and 200-week benchmarks preserve the broader long-term uptrend. The 8556 level is the immediate structural support, 8358 is the next lower swing support, and 9327 remains the major overhead pivot resistance. The current rebound has the appearance of a high-volatility countertrend recovery within a short-term corrective structure.
Chart Analysis ATS AI Generated: 2026-10-15 07:10 for Informational use only, not trading advice. Terms and Risk Disclosure Copyright © 2026. Algo Trading Systems LLC.