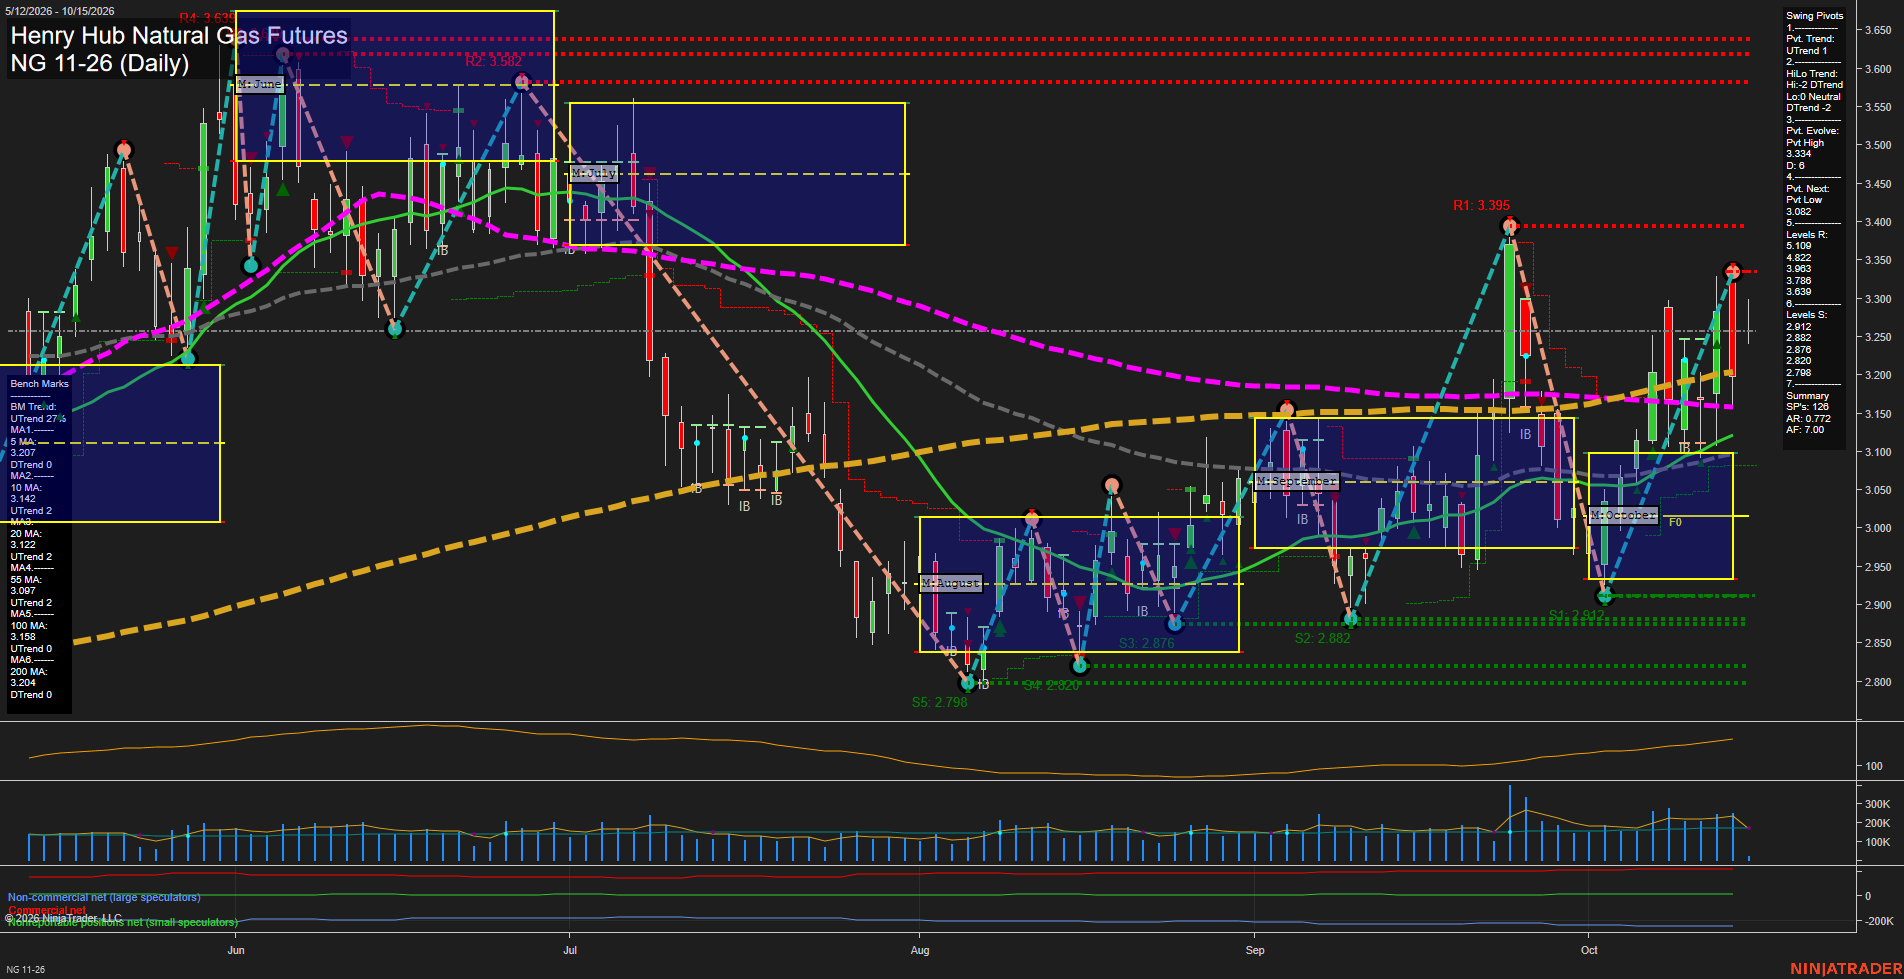
NG Henry Hub Natural Gas Futures Daily Chart Analysis: 2026-Oct-15 07:06 CT
Price Action
- Last: 3.268,
- Bars: Medium,
- Mom: Fast.
WSFG Weekly
- Short-Term
- WSFG Current: 35%
- F0%/NTZ' Bias: Price Above,
- WSFG Trend: Up.
MSFG Month Oct
- Intermediate-Term
- MSFG Current: 66%
- F0%/NTZ' Bias: Price Above,
- MSFG Trend: Up.
YSFG Year 2026
- Long-Term
- YSFG Current: 23%
- F0%/NTZ' Bias: Price Above,
- YSFG Trend: Up.
Swing Pivots
- (Short-Term) 1. Pvt. Trend: UTrend,
- (Intermediate-Term) 2. HiLo Trend: DTrend,
- 3. Pvt. Evolve: Pvt high 3.334,
- 4. Pvt. Next: Pvt low 3.082,
- 5. Levels R: 4.199, 3.903, 3.822, 3.786, 3.639,
- 6. Levels S: 2.912, 2.882, 2.876, 2.820, 2.798.
Daily Benchmarks
- (Short-Term) 5 Day: 3.207 Down Trend,
- (Short-Term) 10 Day: 3.142 Up Trend,
- (Intermediate-Term) 20 Day: 3.122 Up Trend,
- (Intermediate-Term) 55 Day: 3.097 Up Trend,
- (Long-Term) 100 Day: 3.158 Up Trend,
- (Long-Term) 200 Day: 3.204 Down Trend.
Additional Metrics
Recent Trade Signals
- 14 Oct 2026: Short NG 11-26 @ 3.187 Signals.USAR.TR120
- 13 Oct 2026: Long NG 11-26 @ 3.228 Signals.USAR-WSFG
Overall Rating
- Short-Term: Bullish,
- Intermediate-Term: Bullish,
- Long-Term: Neutral.
Key Insights Summary
Price is holding above the weekly, monthly, and yearly F0% reference areas while trading above the rising 10-, 20-, 55-, and 100-day benchmarks. The short-term pivot structure is in an UTrend following the sharp rebound from the 2.912 support area, although the intermediate HiLo trend remains DTrend after the larger decline from the summer highs. The 3.334 evolving pivot high is the immediate structural ceiling, with 3.639 and higher resistance levels marking the broader overhead supply zone. Fast momentum and medium-range daily bars reflect an active, high-volatility recovery phase, while the mixed 5-day and 200-day trends keep the larger trend picture transitional rather than fully aligned.
Chart Analysis ATS AI Generated: 2026-10-15 07:06 for Informational use only, not trading advice. Terms and Risk Disclosure Copyright © 2026. Algo Trading Systems LLC.