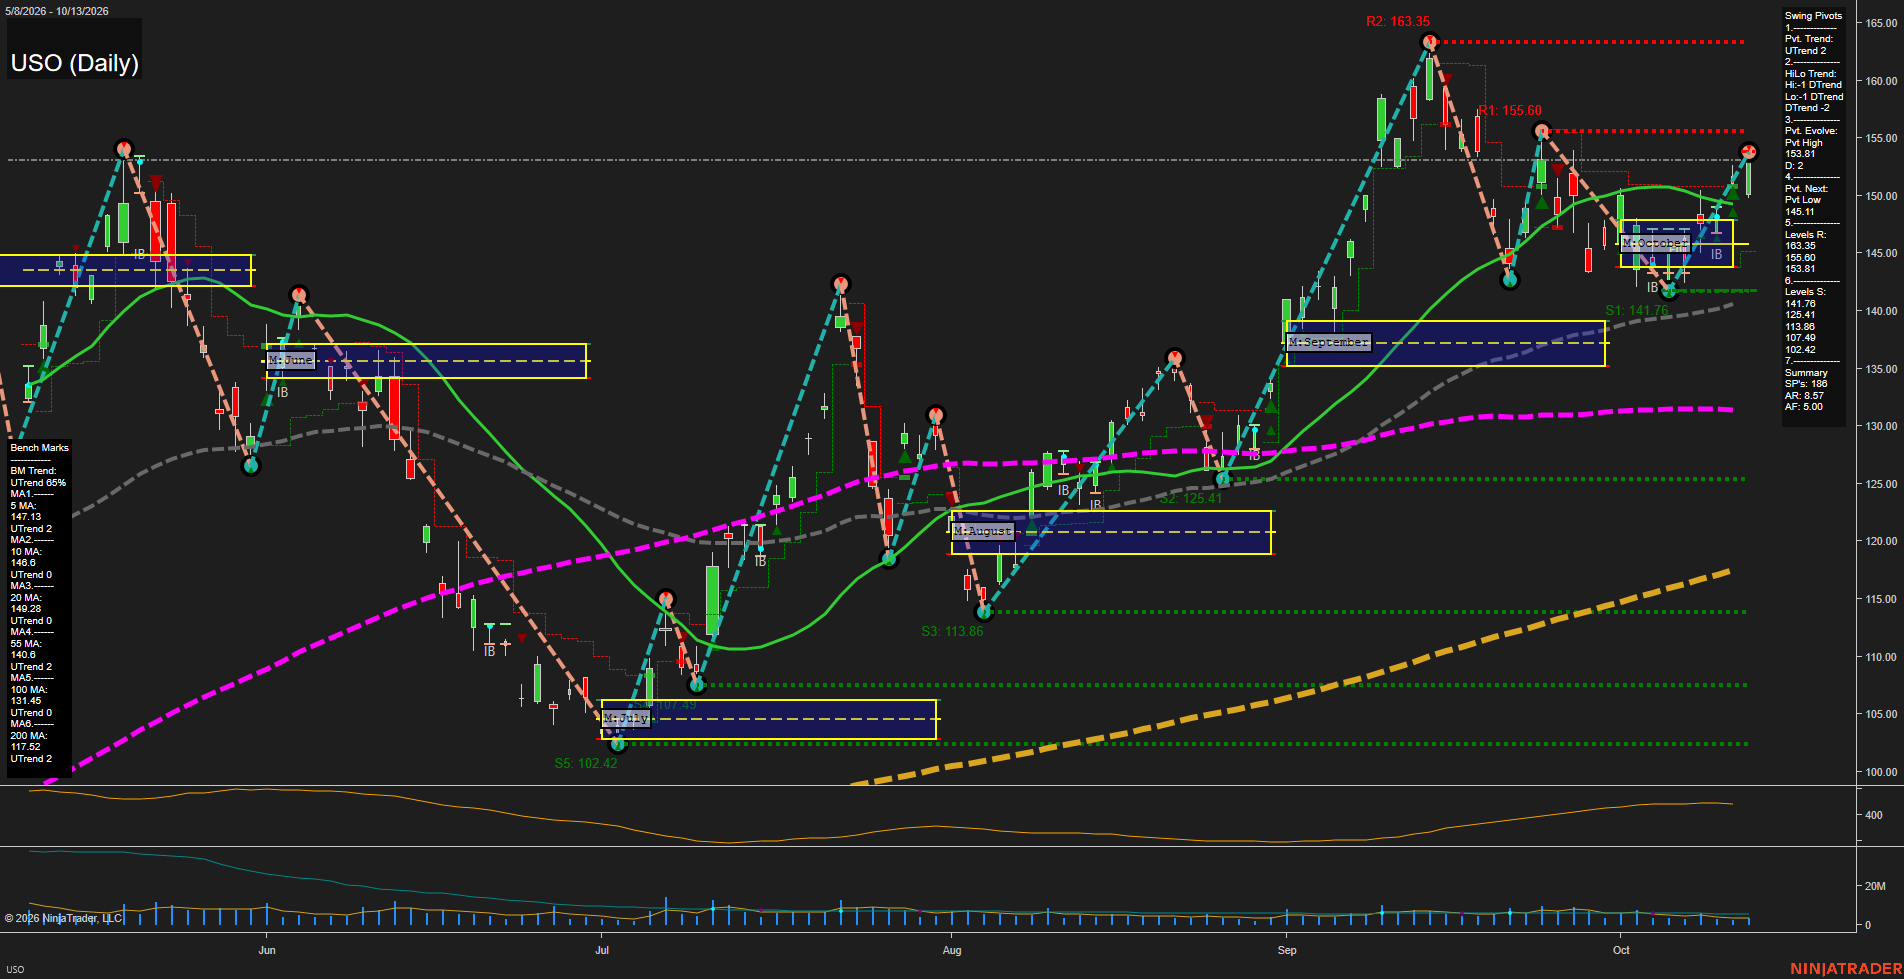
USO United States Oil Fund LP Daily Chart Analysis: 2026-Oct-14 07:11 CT
Price Action
- Last: 153.81,
- Bars: Medium,
- Mom: fast.
WSFG Weekly
- Short-Term
- WSFG Current: NA%
- F0%/NTZ' Bias: Price Bullish,
- WSFG Trend: UTrend.
MSFG Month Oct
- Intermediate-Term
- MSFG Current: NA%
- F0%/NTZ' Bias: Price Bullish,
- MSFG Trend: UTrend.
YSFG Year 2026
- Long-Term
- YSFG Current: NA%
- F0%/NTZ' Bias: Price Bullish,
- YSFG Trend: UTrend.
Swing Pivots
- (Short-Term) 1. Pvt. Trend: UTrend,
- (Intermediate-Term) 2. HiLo Trend: DTrend,
- 3. Pvt. Evolve: Pvt high 153.81,
- 4. Pvt. Next: Pvt low 145.11,
- 5. Levels R: 163.35, 155.60, 153.81,
- 6. Levels S: 141.76, 125.41, 113.86, 107.49, 102.42.
Daily Benchmarks
- (Short-Term) 5 Day: 147.13 Up Trend,
- (Short-Term) 10 Day: 146.60 Up Trend,
- (Intermediate-Term) 20 Day: 149.28 Up Trend,
- (Intermediate-Term) 55 Day: 140.60 Up Trend,
- (Long-Term) 100 Day: 131.45 Up Trend,
- (Long-Term) 200 Day: 117.52 Up Trend.
Additional Metrics
- ATR: 8.57,
- VOLMA: 2577640.
Overall Rating
- Short-Term: Bullish,
- Intermediate-Term: Bullish,
- Long-Term: Bullish.
Key Insights Summary
USO reflects a strong crude-oil proxy advance, with price recovering sharply from the 141.76 swing support and pressing into the 153.81 pivot-high area. The short-term pivot structure is positive and price is above all benchmark averages, while the rising 20-, 55-, 100-, and 200-day averages confirm broad trend participation. The intermediate HiLo structure remains DTrend because the 163.35 September high has not been exceeded; therefore, the current rally remains a retracement within that broader swing range until higher resistance is resolved. The 155.60 and 163.35 pivot levels define the overhead supply zone, while 145.11 and 141.76 identify the nearest structural pullback area. Daily ATR near 8.57 indicates elevated swing-range potential, consistent with energetic crude-related price movement rather than a low-volatility consolidation.
Chart Analysis ATS AI Generated: 2026-10-14 07:12 for Informational use only, not trading advice. Terms and Risk Disclosure Copyright © 2026. Algo Trading Systems LLC.