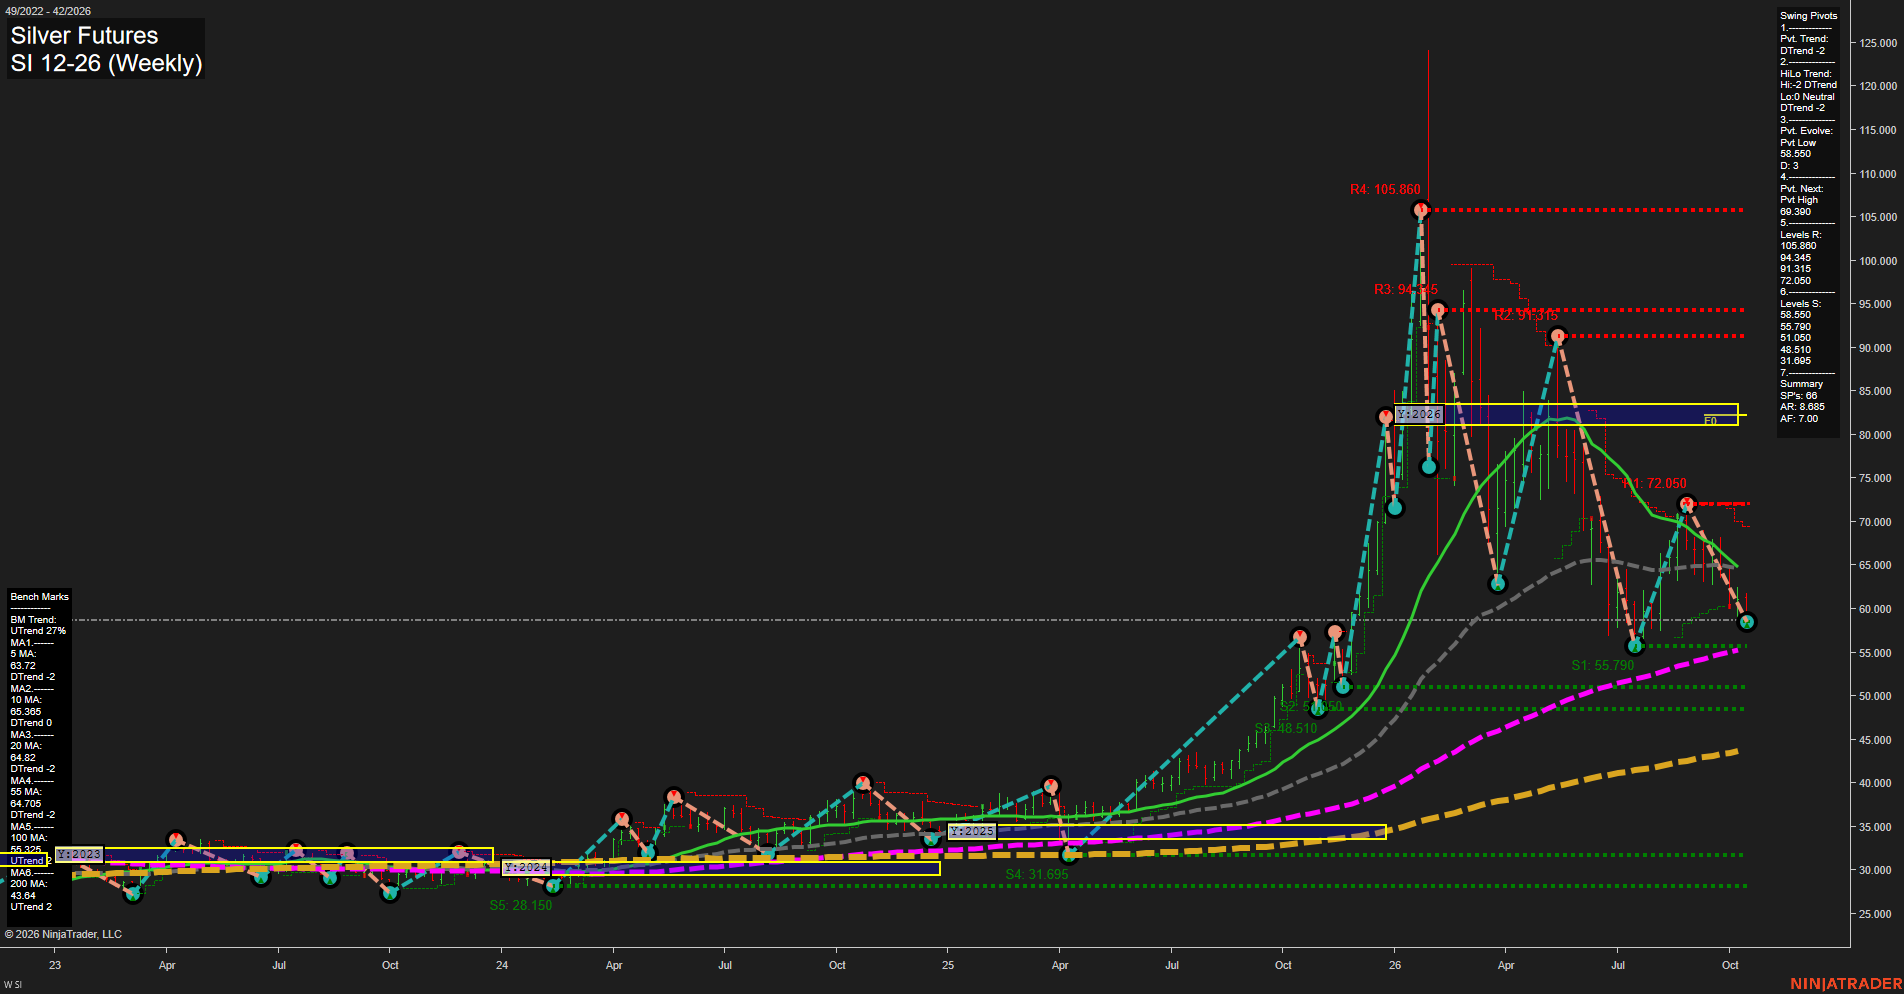
SI Silver Futures Weekly Chart Analysis: 2026-Oct-14 07:10 CT
Price Action
- Last: 58.870,
- Bars: Small,
- Mom: fast.
WSFG Weekly
- Short-Term
- WSFG Current: -58%
- F0%/NTZ' Bias: Price Below,
- WSFG Trend: Down.
MSFG Month Oct
- Intermediate-Term
- MSFG Current: -23%
- F0%/NTZ' Bias: Price Below,
- MSFG Trend: Down.
YSFG Year 2026
- Long-Term
- YSFG Current: -193%
- F0%/NTZ' Bias: Price Below,
- YSFG Trend: Down.
Swing Pivots
- (Short-Term) 1. Pvt. Trend: DTrend,
- (Intermediate-Term) 2. HiLo Trend: DTrend,
- 3. Pvt. Evolve: Pvt low 58.500,
- 4. Pvt. Next: Pvt high 69.390,
- 5. Levels R: 105.860, 94.345, 91.315, 72.050,
- 6. Levels S: 58.500, 55.790, 51.050, 48.510, 31.695.
Weekly Benchmarks
- (Short-Term) 5 Day: 63.740 Down Trend,
- (Short-Term) 10 Day: 65.385 Down Trend,
- (Intermediate-Term) 20 Day: 64.820 Down Trend,
- (Intermediate-Term) 55 Day: 64.705 Down Trend,
- (Long-Term) 100 Day: 55.325 Up Trend,
- (Long-Term) 200 Day: 43.642 Up Trend.
Recent Trade Signals
- 14 Oct 2026: Short SI 12-26 @ 58.87 Signals.USAR-MSFG
- 13 Oct 2026: Short SI 12-26 @ 59.91 Signals.USAR.TR120
- 13 Oct 2026: Short SI 12-26 @ 60.805 Signals.USAR-WSFG
Overall Rating
- Short-Term: Bearish,
- Intermediate-Term: Bearish,
- Long-Term: Bearish.
Key Insights Summary
Price is pressing the 58.500 evolving pivot low after a fast decline from the 72.050 swing resistance area. Weekly and monthly Fib-grid readings remain below F0% and all pivot trend measures are down, confirming a lower-high/lower-low corrective structure. The 5, 10, 20, and 55-week benchmarks are declining above price, while the rising 100- and 200-week averages show that the larger historical trend structure remains elevated despite the current deep retracement. Support is clustered at 58.500 and 55.790, with 69.390 defining the next opposite pivot threshold.
Chart Analysis ATS AI Generated: 2026-10-14 07:10 for Informational use only, not trading advice. Terms and Risk Disclosure Copyright © 2026. Algo Trading Systems LLC.