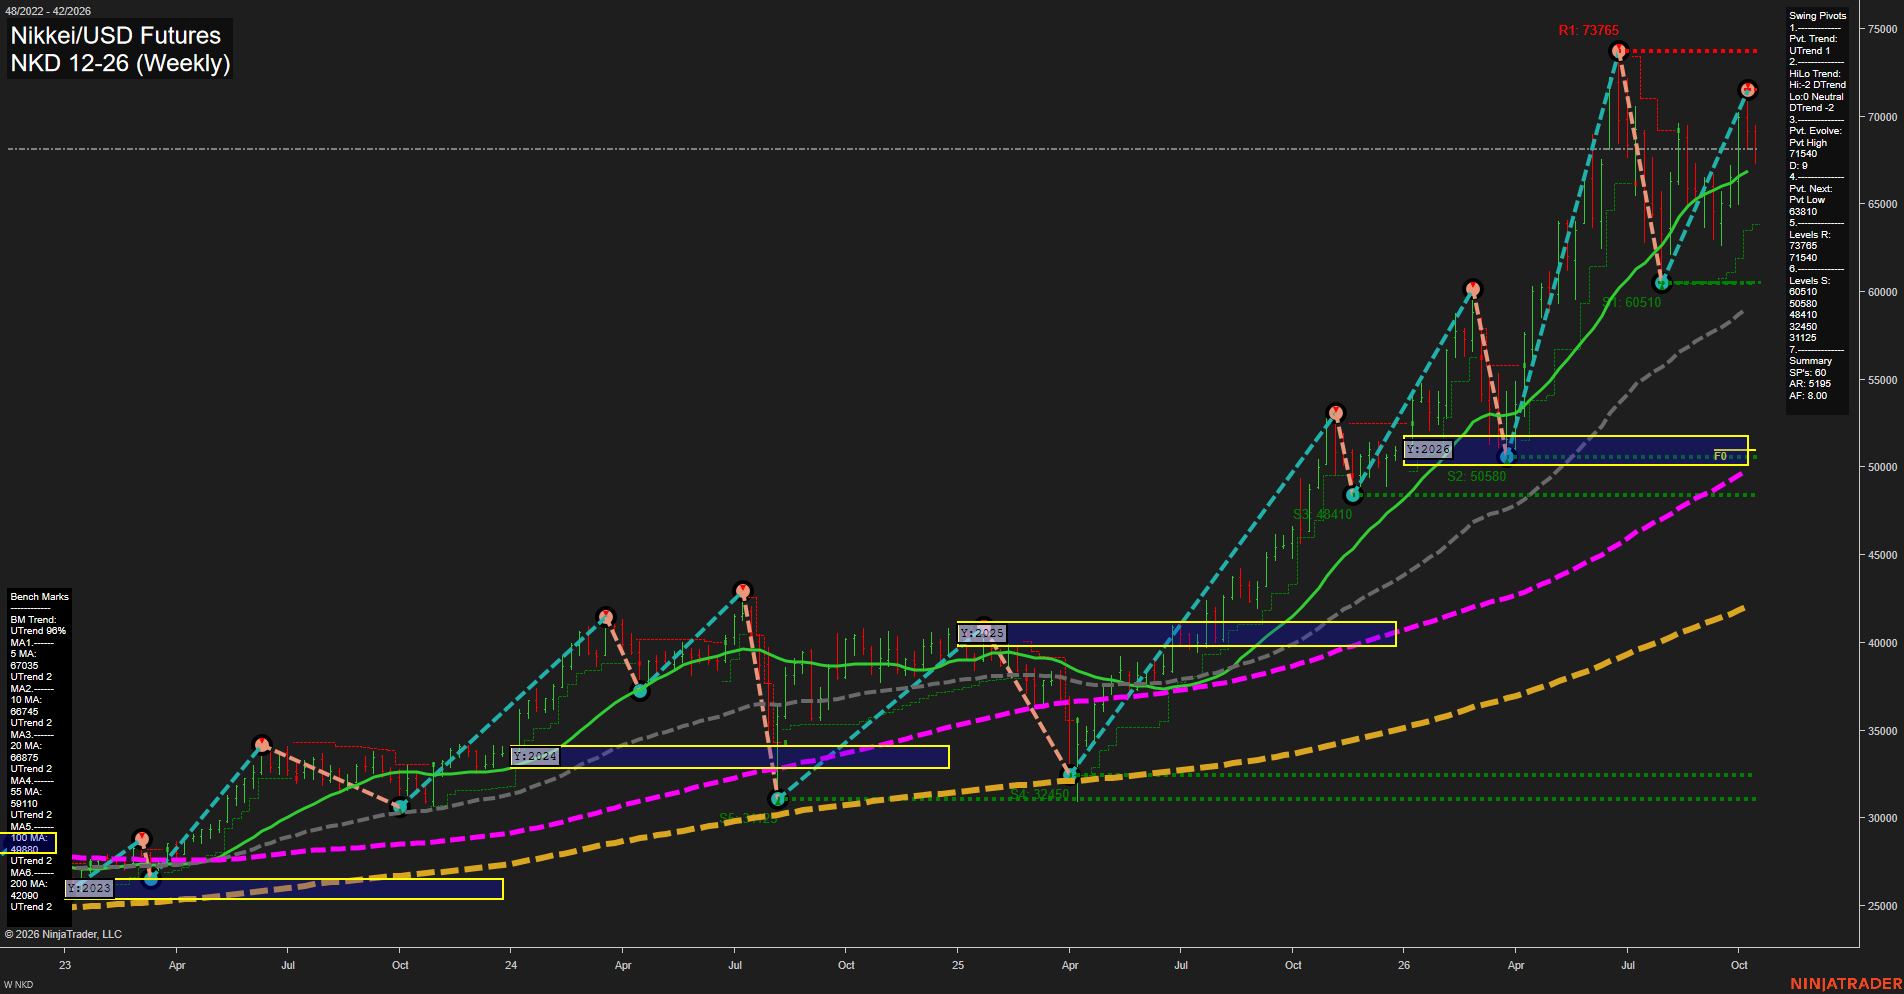
NKD Nikkei/USD Futures Weekly Chart Analysis: 2026-Oct-14 07:08 CT
Price Action
- Last: 68000,
- Bars: Medium,
- Mom: fast.
WSFG Weekly
- Short-Term
- WSFG Current: -26%
- F0%/NTZ' Bias: Price Below,
- WSFG Trend: Down.
MSFG Month Oct
- Intermediate-Term
- MSFG Current: -8%
- F0%/NTZ' Bias: Price Below,
- MSFG Trend: Down.
YSFG Year 2026
- Long-Term
- YSFG Current: 207%
- F0%/NTZ' Bias: Price Above,
- YSFG Trend: Up.
Swing Pivots
- (Short-Term) 1. Pvt. Trend: UTrend,
- (Intermediate-Term) 2. HiLo Trend: DTrend,
- 3. Pvt. Evolve: Pvt high 71540,
- 4. Pvt. Next: Pvt low 63810,
- 5. Levels R: 73765, 71540,
- 6. Levels S: 60510, 50580, 48410, 32450, 31125.
Weekly Benchmarks
- (Short-Term) 5 Day: 67035 Up Trend,
- (Short-Term) 10 Day: 66745 Up Trend,
- (Intermediate-Term) 20 Day: 66875 Up Trend,
- (Intermediate-Term) 55 Day: 59110 Up Trend,
- (Long-Term) 100 Day: 49080 Up Trend,
- (Long-Term) 200 Day: 42080 Up Trend.
Recent Trade Signals
- 14 Oct 2026: Short NKD 12-26 @ 68000 Signals.USAR-MSFG
- 08 Oct 2026: Short NKD 12-26 @ 69475 Signals.USAR-WSFG
- 07 Oct 2026: Short NKD 12-26 @ 70275 Signals.USAR.TR120
Overall Rating
- Short-Term: Bearish,
- Intermediate-Term: Bearish,
- Long-Term: Bullish.
Key Insights Summary
NKD remains in a powerful long-term advance above all six rising weekly benchmarks and well above the yearly F0% area. The current structure is a volatile countertrend retracement within that larger uptrend: weekly and monthly Fib-grid readings are below their F0%/NTZ zones, while intermediate pivot structure remains in a DTrend. Short-term pivot trend is UTrend following the rebound from 60510, but the evolving pivot high at 71540 and resistance at 73765 define the overhead recovery structure. Price near 68000 is holding above the short moving-average cluster, although recent short signals and the lower-high pivot sequence keep the near-term swing tone bearish.
Chart Analysis ATS AI Generated: 2026-10-14 07:08 for Informational use only, not trading advice. Terms and Risk Disclosure Copyright © 2026. Algo Trading Systems LLC.