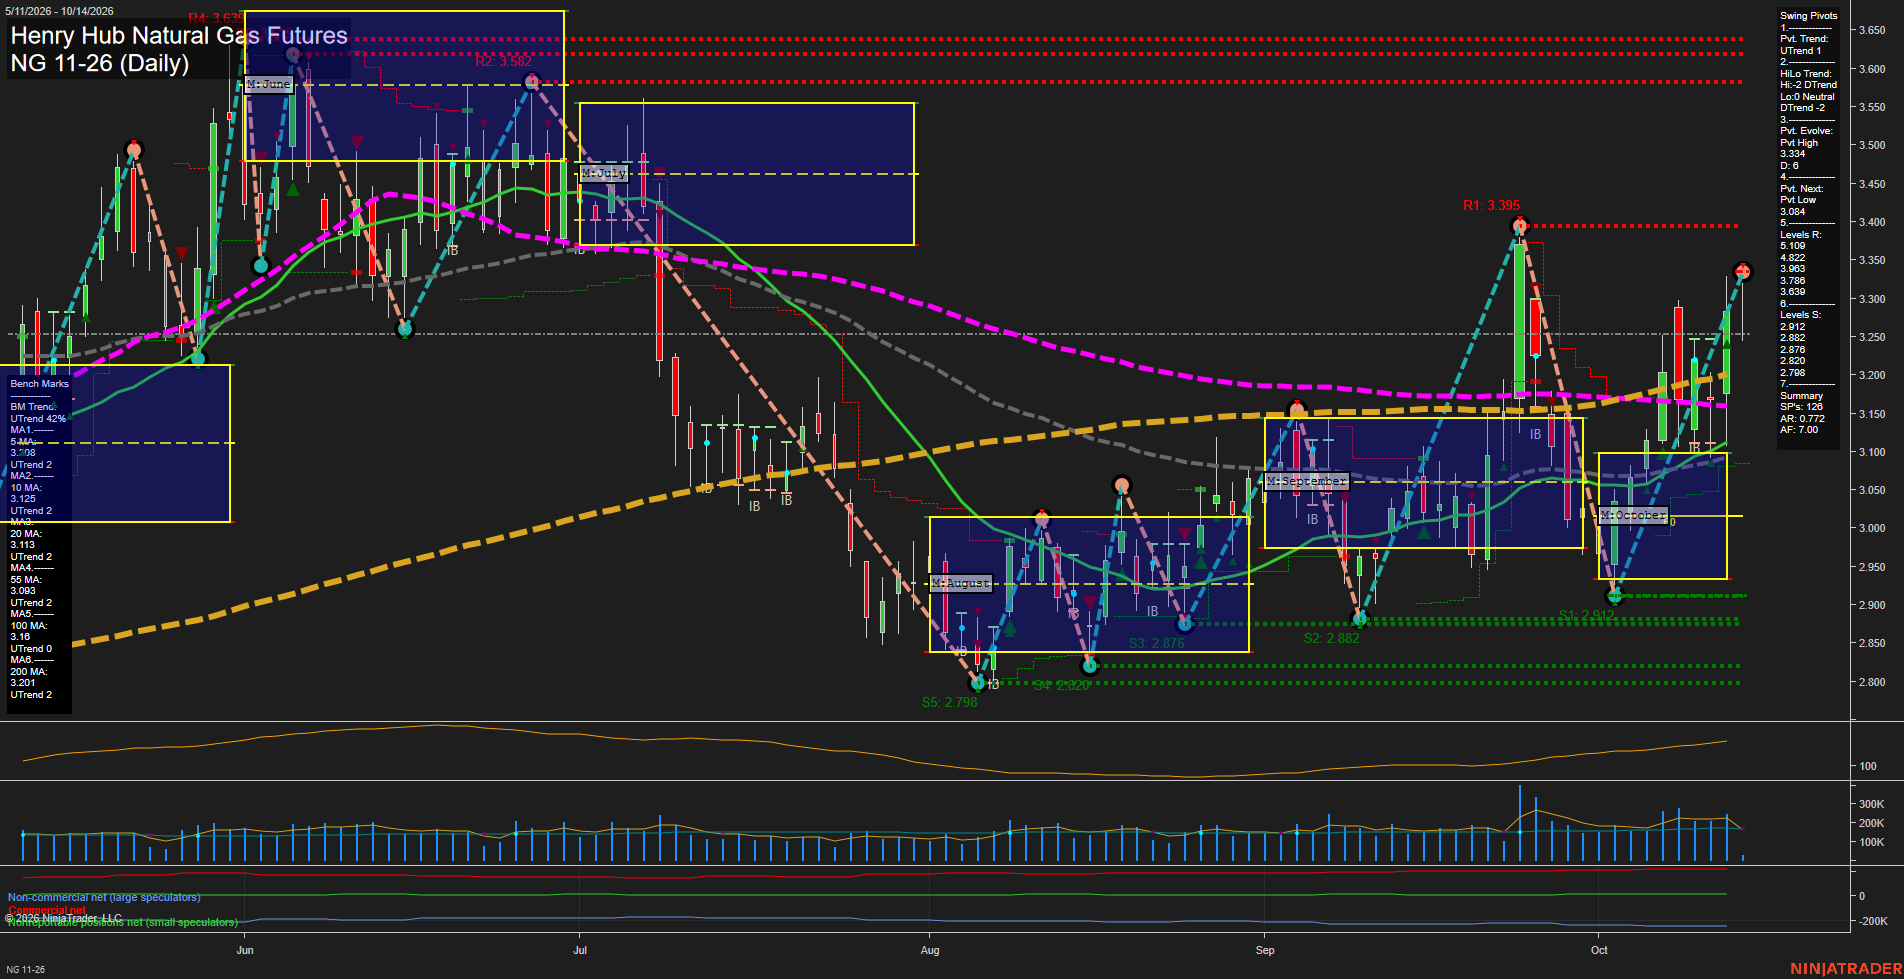
NG Henry Hub Natural Gas Futures Daily Chart Analysis: 2026-Oct-14 07:07 CT
Price Action
- Last: 3.252,
- Bars: Medium,
- Mom: fast.
WSFG Weekly
- Short-Term
- WSFG Current: 32%
- F0%/NTZ' Bias: Price Above,
- WSFG Trend: Up.
MSFG Month Oct
- Intermediate-Term
- MSFG Current: 65%
- F0%/NTZ' Bias: Price Above,
- MSFG Trend: Up.
YSFG Year 2026
- Long-Term
- YSFG Current: 23%
- F0%/NTZ' Bias: Price Above,
- YSFG Trend: Up.
Swing Pivots
- (Short-Term) 1. Pvt. Trend: UTrend,
- (Intermediate-Term) 2. HiLo Trend: DTrend,
- 3. Pvt. Evolve: Pvt high 3.334,
- 4. Pvt. Next: Pvt low 3.084,
- 5. Levels R: 5.109, 4.822, 3.983, 3.780, 3.639,
- 6. Levels S: 2.912, 2.882, 2.876, 2.820, 2.798.
Daily Benchmarks
- (Short-Term) 5 Day: 3.307 Up Trend,
- (Short-Term) 10 Day: 3.125 Up Trend,
- (Intermediate-Term) 20 Day: 3.113 Up Trend,
- (Intermediate-Term) 55 Day: 3.093 Up Trend,
- (Long-Term) 100 Day: 3.160 Up Trend,
- (Long-Term) 200 Day: 3.201 Up Trend.
Additional Metrics
Recent Trade Signals
- 13 Oct 2026: Long NG 11-26 @ 3.228 Signals.USAR-WSFG
Overall Rating
- Short-Term: Bullish,
- Intermediate-Term: Bullish,
- Long-Term: Bullish.
Key Insights Summary
NG has produced a sharp October V-style recovery from the 2.912 pivot low, restoring the short-term pivot trend to UTrend and lifting price above the 10-, 20-, 55-, 100-, and 200-day benchmarks. The current 3.252 price remains below the rising 5-day average at 3.307 and beneath the evolving 3.334 swing high, defining the immediate retracement and breakout reference area. Intermediate HiLo structure remains DTrend, so the recent rally is occurring within a broader corrective structure despite constructive monthly and yearly fib-grid trends. Support is clustered at 2.912 through 2.798, while the first notable overhead swing resistance is 3.639. Rising ATR and active volume reflect an expanded-volatility natural-gas swing environment.
Chart Analysis ATS AI Generated: 2026-10-14 07:07 for Informational use only, not trading advice. Terms and Risk Disclosure Copyright © 2026. Algo Trading Systems LLC.