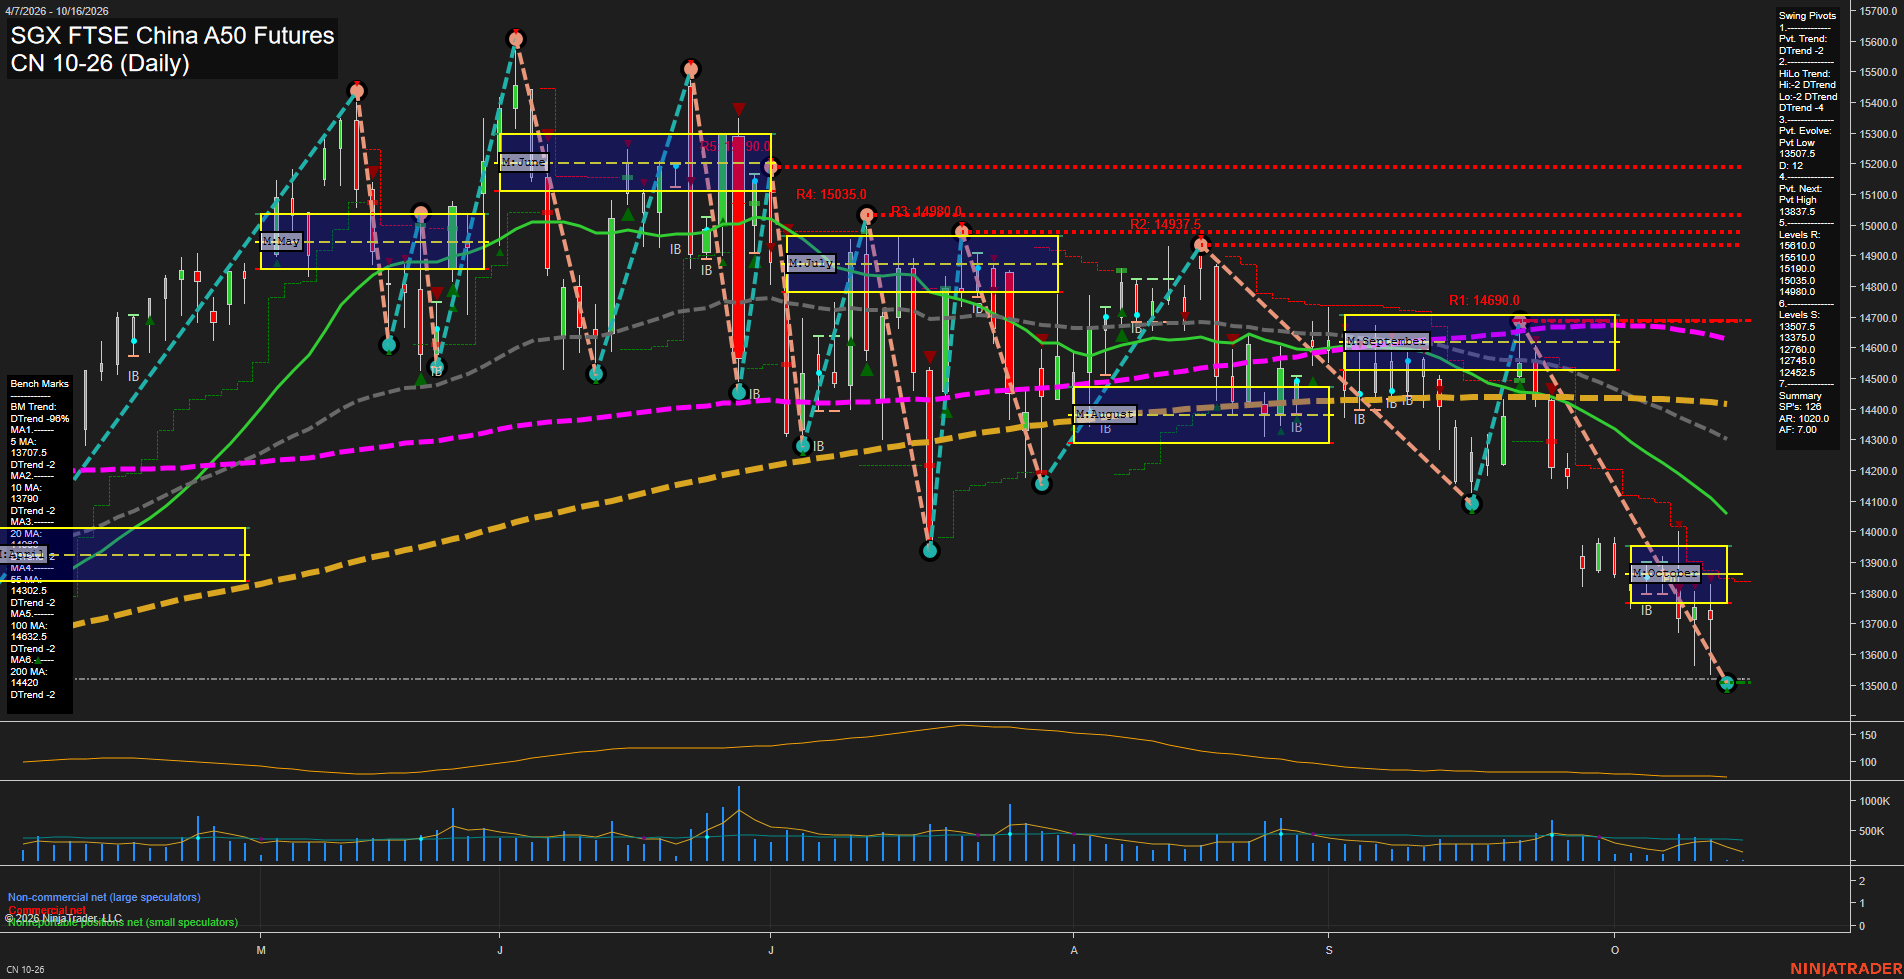
CN SGX FTSE China A50 Futures Daily Chart Analysis: 2026-Oct-14 07:03 CT
Price Action
- Last: 13507.5,
- Bars: Medium,
- Mom: Fast.
WSFG Weekly
- Short-Term
- WSFG Current: NA%
- F0%/NTZ' Bias: Price Neutral,
- WSFG Trend: Neutral.
MSFG Month Oct
- Intermediate-Term
- MSFG Current: NA%
- F0%/NTZ' Bias: Price Below NTZ,
- MSFG Trend: DTrend.
YSFG Year 2026
- Long-Term
- YSFG Current: NA%
- F0%/NTZ' Bias: Price Neutral,
- YSFG Trend: Neutral.
Swing Pivots
- (Short-Term) 1. Pvt. Trend: DTrend,
- (Intermediate-Term) 2. HiLo Trend: DTrend,
- 3. Pvt. Evolve: Pvt low 13507.5,
- 4. Pvt. Next: Pvt high 13837.5,
- 5. Levels R: 15610.0, 15510.0, 15190.0, 15035.0, 14980.0,
- 6. Levels S: 13507.5, 13375.0, 12760.0, 12745.5, 12452.5.
Daily Benchmarks
- (Short-Term) 5 Day: 13707.5 Down Trend,
- (Short-Term) 10 Day: 13790.0 Down Trend,
- (Intermediate-Term) 20 Day: 13981.0 Down Trend,
- (Intermediate-Term) 55 Day: 14302.5 Down Trend,
- (Long-Term) 100 Day: 14632.5 Down Trend,
- (Long-Term) 200 Day: 14420.0 Down Trend.
Additional Metrics
- ATR: 102.0,
- VOLMA: 261842.
Overall Rating
- Short-Term: Bearish,
- Intermediate-Term: Bearish,
- Long-Term: Bearish.
Key Insights Summary
The daily structure is decisively bearish, with price at 13507.5 beneath every benchmark average and with both short-term pivot and intermediate HiLo trends in DTrend. The decline has accelerated through the October monthly grid and produced a sequence of lower highs and lower lows. The latest pivot low at 13507.5 is the nearest structural support, while 13837.5 defines the next opposite-pivot reversal level and the 5-day and 10-day averages remain overhead. ATR at 102.0 reflects elevated daily range conditions relative to the compressed volume backdrop, consistent with a persistent selloff rather than a broad accumulation pattern.
Chart Analysis ATS AI Generated: 2026-10-14 07:03 for Informational use only, not trading advice. Terms and Risk Disclosure Copyright © 2026. Algo Trading Systems LLC.