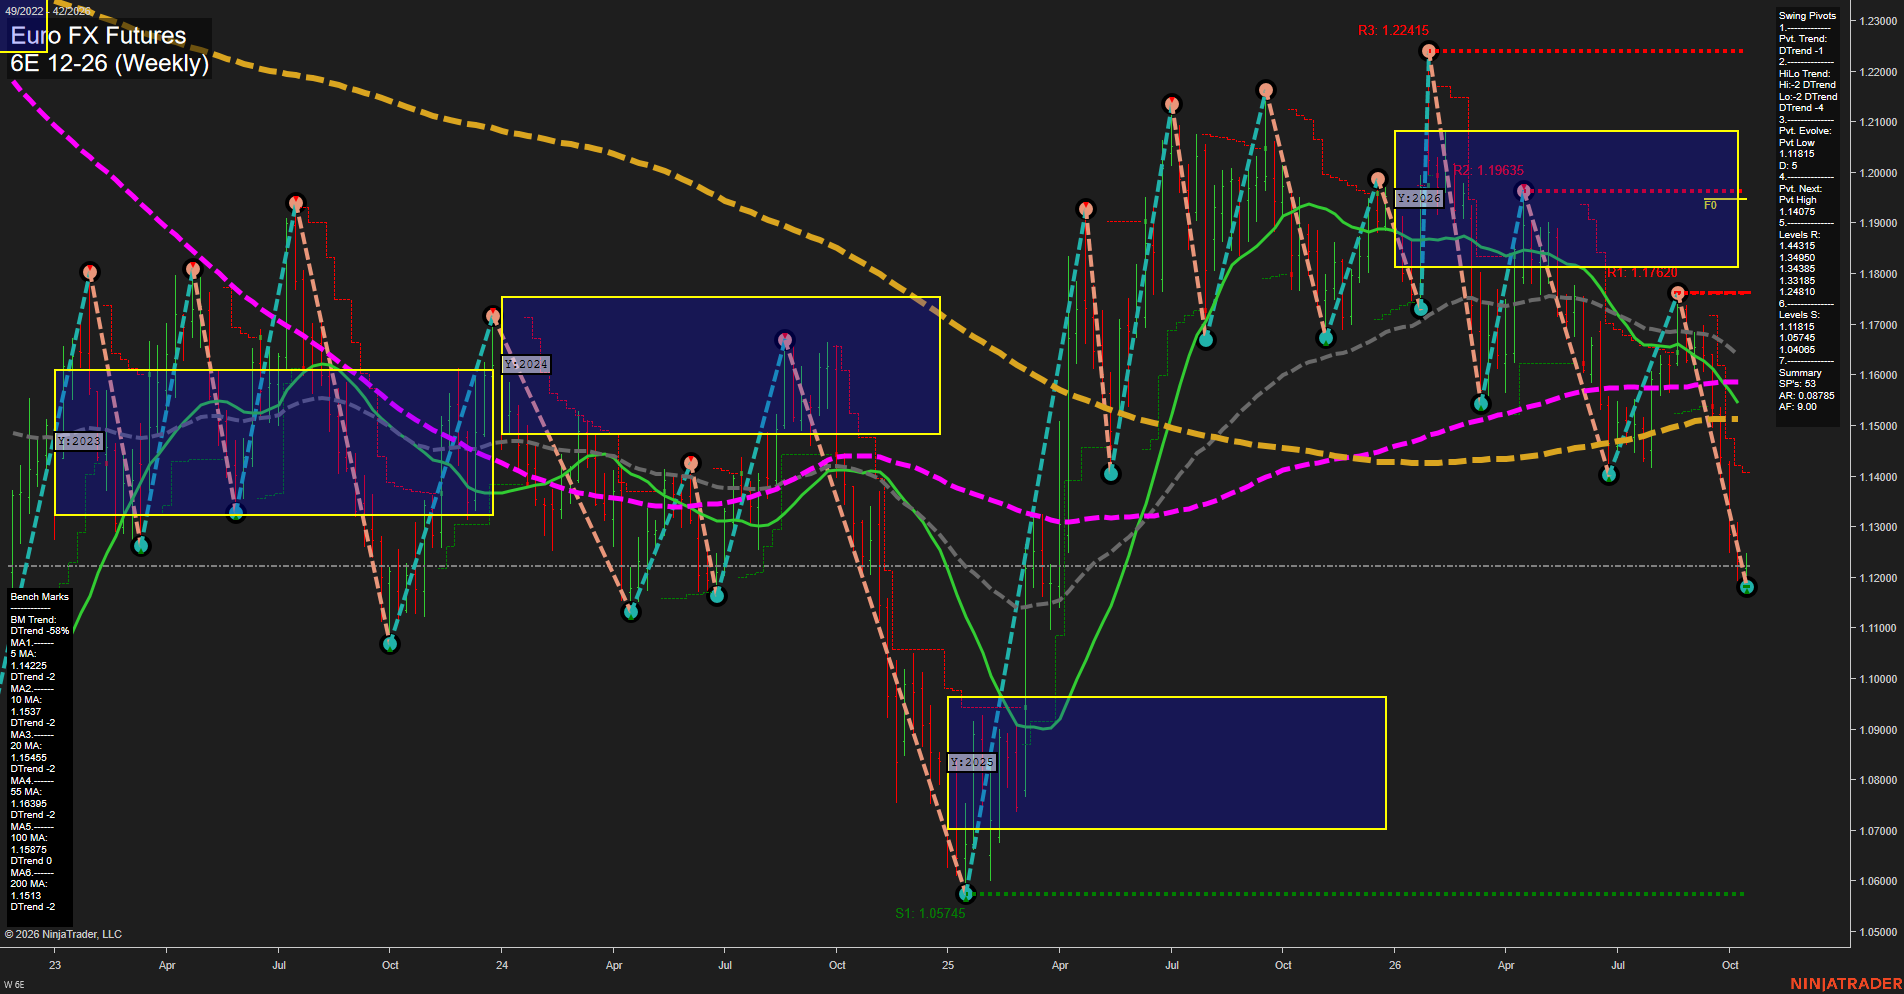
6E Euro FX Futures Weekly Chart Analysis: 2026-Oct-14 07:01 CT
Price Action
- Last: 1.12300,
- Bars: Large,
- Mom: fast.
WSFG Weekly
- Short-Term
- WSFG Current: 3%
- F0%/NTZ' Bias: Price Above,
- WSFG Trend: Up.
MSFG Month Oct
- Intermediate-Term
- MSFG Current: -55%
- F0%/NTZ' Bias: Price Below,
- MSFG Trend: Down.
YSFG Year 2026
- Long-Term
- YSFG Current: -54%
- F0%/NTZ' Bias: Price Below,
- YSFG Trend: Down.
Swing Pivots
- (Short-Term) 1. Pvt. Trend: DTrend,
- (Intermediate-Term) 2. HiLo Trend: DTrend,
- 3. Pvt. Evolve: Pvt low 1.11815,
- 4. Pvt. Next: Pvt high 1.14075,
- 5. Levels R: 1.43450, 1.34385, 1.31150, 1.24810,
- 6. Levels S: 1.11815, 1.10745, 1.04085.
Weekly Benchmarks
- (Short-Term) 5 Day: 1.14225 Down Trend,
- (Short-Term) 10 Day: 1.15370 Down Trend,
- (Intermediate-Term) 20 Day: 1.15455 Down Trend,
- (Intermediate-Term) 55 Day: 1.16395 Down Trend,
- (Long-Term) 100 Day: 1.15875 Down Trend,
- (Long-Term) 200 Day: 1.15300 Down Trend.
Recent Trade Signals
- 14 Oct 2026: Long 6E 12-26 @ 1.12365 Signals.USAR-WSFG
- 13 Oct 2026: Long 6E 12-26 @ 1.1226 Signals.USAR.TR120
Overall Rating
- Short-Term: Bullish,
- Intermediate-Term: Bearish,
- Long-Term: Bearish.
Key Insights Summary
The weekly chart shows a sharp, high-momentum selloff into the 1.11815 pivot low, leaving short-term price action structurally in a DTrend despite the positive weekly fib-grid position and recent long signals. Price remains below every listed benchmark average, confirming broad intermediate and long-term downside alignment. The 1.14075 pivot-high reversal level defines the nearest structural recovery threshold, while 1.11815 is the immediate support reference; a break beneath it would extend the established sequence of lower highs and lower lows.
Chart Analysis ATS AI Generated: 2026-10-14 07:01 for Informational use only, not trading advice. Terms and Risk Disclosure Copyright © 2026. Algo Trading Systems LLC.