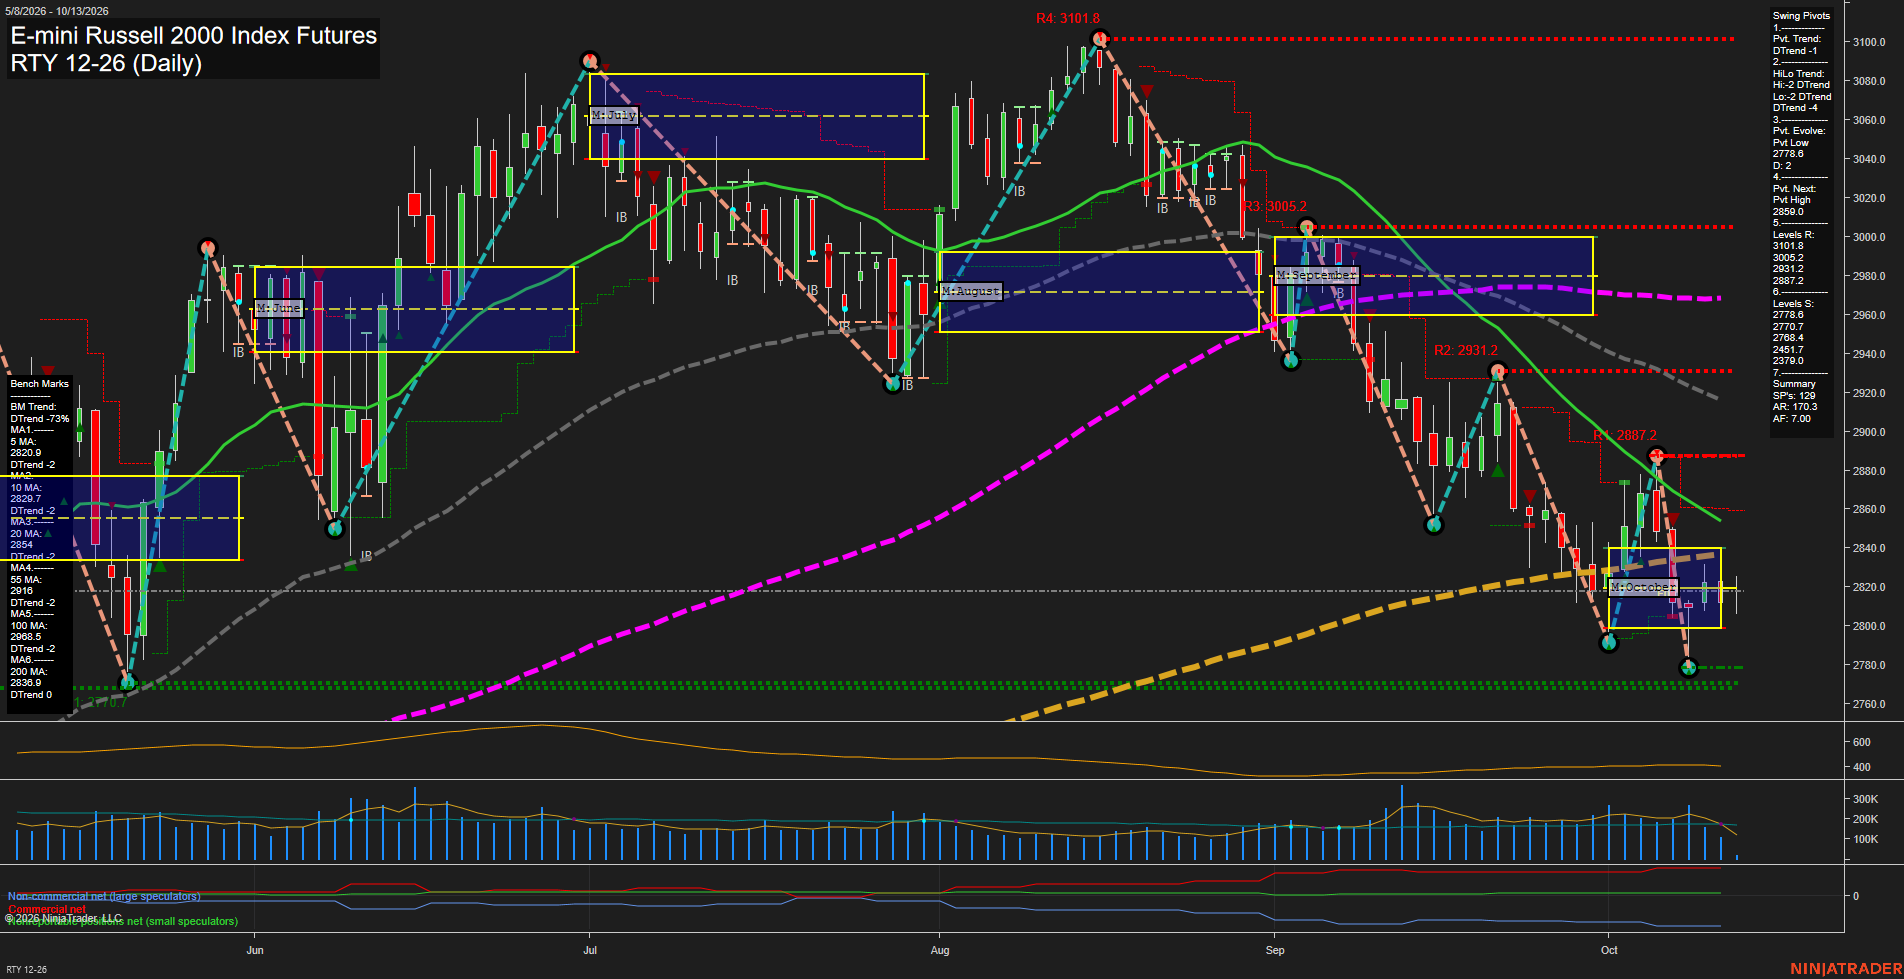
RTY E-mini Russell 2000 Index Futures Daily Chart Analysis: 2026-Oct-13 07:10 CT
Price Action
- Last: 2820.0,
- Bars: Small,
- Mom: slow.
WSFG Weekly
- Short-Term
- WSFG Current: -6%
- F0%/NTZ' Bias: Price Below,
- WSFG Trend: Down.
MSFG Month Oct
- Intermediate-Term
- MSFG Current: -7%
- F0%/NTZ' Bias: Price Below,
- MSFG Trend: Down.
YSFG Year 2026
- Long-Term
- YSFG Current: 36%
- F0%/NTZ' Bias: Price Above,
- YSFG Trend: Up.
Swing Pivots
- (Short-Term) 1. Pvt. Trend: DTrend,
- (Intermediate-Term) 2. HiLo Trend: DTrend,
- 3. Pvt. Evolve: Pvt low 2778.7,
- 4. Pvt. Next: Pvt high 2859.0,
- 5. Levels R: 3101.8, 3005.2, 2931.2, 2887.2,
- 6. Levels S: 2778.6, 2768.4, 2457.7, 2379.0.
Daily Benchmarks
- (Short-Term) 5 Day: 2820.9 Down Trend,
- (Short-Term) 10 Day: 2829.7 Down Trend,
- (Intermediate-Term) 20 Day: 2854.1 Down Trend,
- (Intermediate-Term) 55 Day: 2916.0 Down Trend,
- (Long-Term) 100 Day: 2968.1 Down Trend,
- (Long-Term) 200 Day: 2838.9 Down Trend.
Additional Metrics
Recent Trade Signals
- 12 Oct 2026: Short RTY 12-26 @ 2813.2 Signals.USAR-WSFG
- 09 Oct 2026: Long RTY 12-26 @ 2819.2 Signals.USAR.TR120
- 08 Oct 2026: Short RTY 12-26 @ 2801.1 Signals.USAR-MSFG
Overall Rating
- Short-Term: Bearish,
- Intermediate-Term: Bearish,
- Long-Term: Bearish.
Key Insights Summary
RTY remains in a broad daily-chart decline, with price below all listed moving-average benchmarks and both the weekly and monthly Fib-grid structures holding below their F0% levels. The short-term pivot sequence is a DTrend, while the intermediate HiLo structure also remains a DTrend. Small candles around 2820 reflect compressed, slower momentum following the recent decline into the 2778 pivot-low area. The 2859 pivot-next level and 2887.2 resistance mark the nearest upside structural barriers, while 2778.6 and 2768.4 define the nearby lower support cluster. The yearly Fib grid remains positive, showing that the current decline is occurring within a longer-term annual upward framework, but daily benchmark alignment and pivot structure continue to characterize the active swing condition as bearish.
Chart Analysis ATS AI Generated: 2026-10-13 07:10 for Informational use only, not trading advice. Terms and Risk Disclosure Copyright © 2026. Algo Trading Systems LLC.