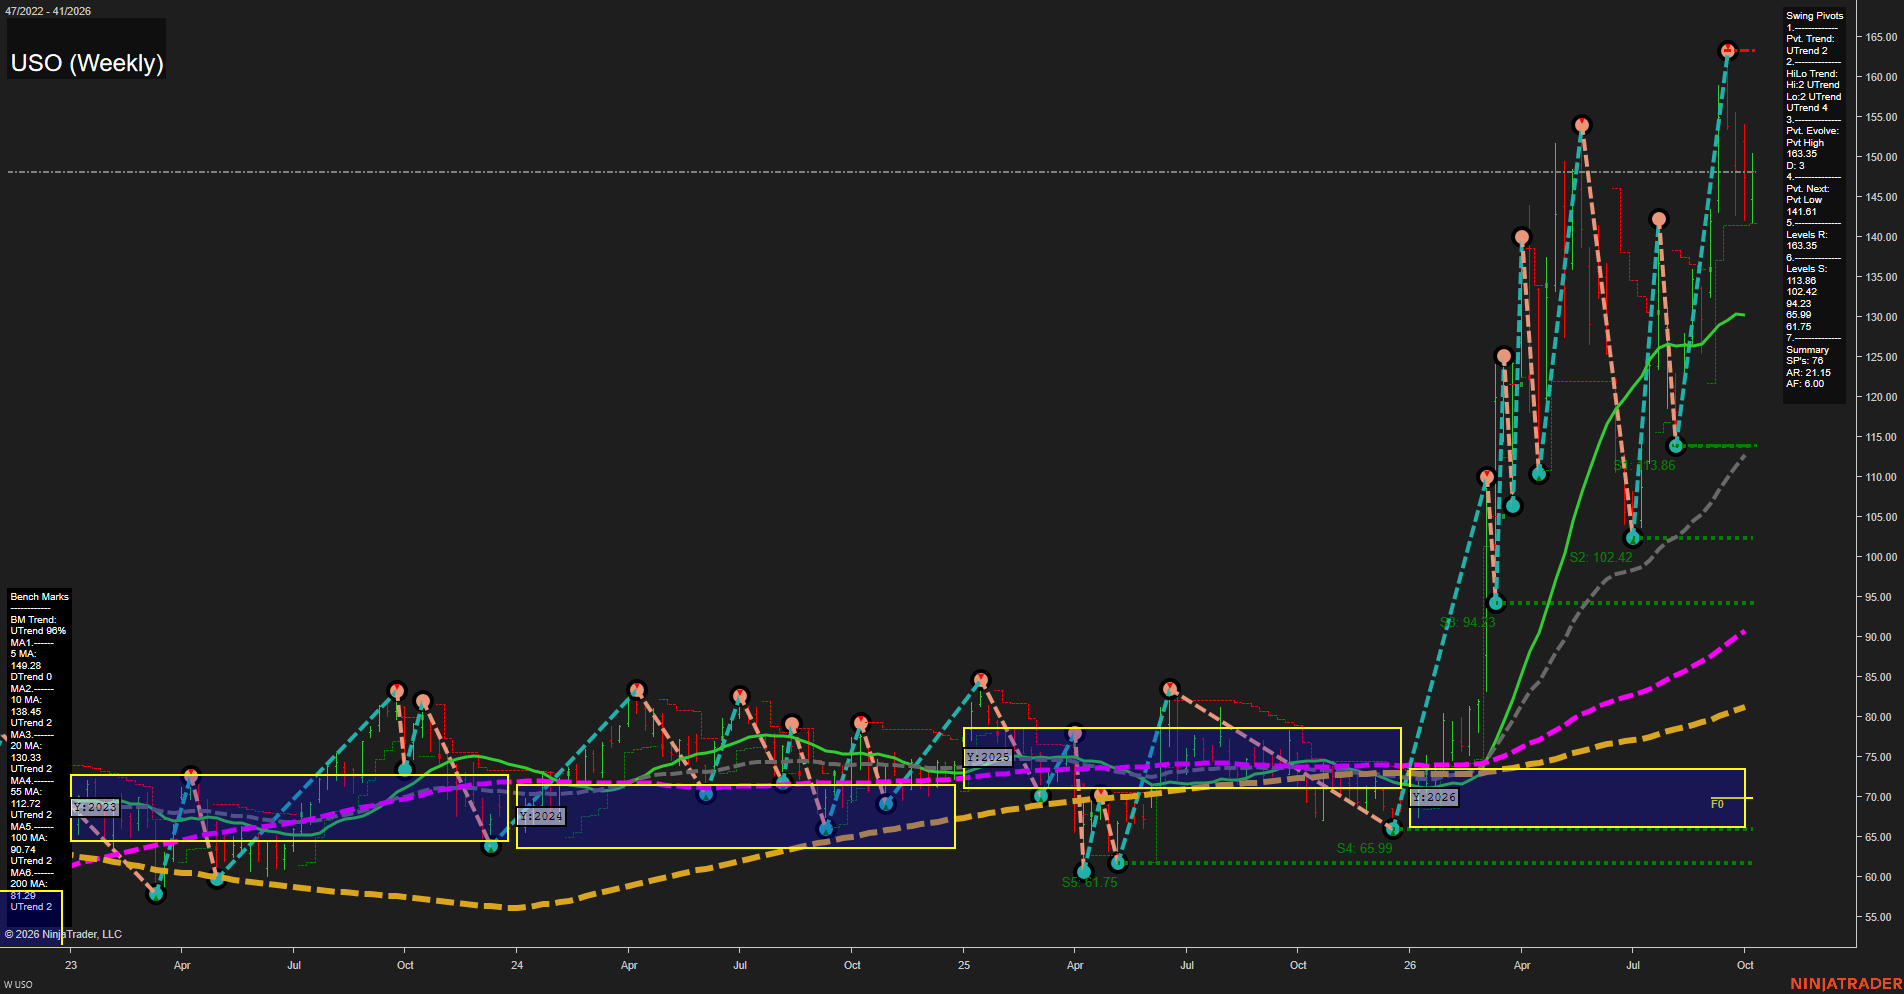
USO United States Oil Fund LP Weekly Chart Analysis: 2026-Oct-12 07:11 CT
Price Action
- Last: 147.51,
- Bars: Large,
- Mom: fast.
WSFG Weekly
- Short-Term
- WSFG Current: NA%
- F0%/NTZ' Bias: Price Bullish,
- WSFG Trend: Bullish.
MSFG Month Oct
- Intermediate-Term
- MSFG Current: NA%
- F0%/NTZ' Bias: Price Bullish,
- MSFG Trend: Bullish.
YSFG Year 2026
- Long-Term
- YSFG Current: NA%
- F0%/NTZ' Bias: Price Bullish,
- YSFG Trend: Bullish.
Swing Pivots
- (Short-Term) 1. Pvt. Trend: UTrend,
- (Intermediate-Term) 2. HiLo Trend: UTrend,
- 3. Pvt. Evolve: Pvt high 163.35,
- 4. Pvt. Next: Pvt low 141.61,
- 5. Levels R: 163.35,
- 6. Levels S: 141.61, 102.42, 94.23, 65.99, 61.75.
Weekly Benchmarks
- (Short-Term) 5 Day: 149.28 Down Trend,
- (Short-Term) 10 Day: 138.45 Up Trend,
- (Intermediate-Term) 20 Day: 130.33 Up Trend,
- (Intermediate-Term) 55 Day: 115.72 Up Trend,
- (Long-Term) 100 Day: 90.74 Up Trend,
- (Long-Term) 200 Day: 81.28 Up Trend.
Overall Rating
- Short-Term: Bullish,
- Intermediate-Term: Bullish,
- Long-Term: Bullish.
Key Insights Summary
USO remains in an exceptionally strong weekly expansion phase, with price far above the 2026 yearly NTZ/F0% area and above every rising intermediate- and long-term benchmark. The pivot structure remains an UTrend on both short- and intermediate-term measures, although the latest large-range reversal from the 163.35 pivot high shows elevated crude-linked volatility. The 149.28 declining 5-period benchmark is immediate overhead, while 141.61 defines the active pivot-reversal reference; beneath it, 130.33 and 115.72 are the principal moving-average trend zones. The broader structure reflects a powerful breakout and trend continuation following the 2025-early-2026 base, rather than a mature sideways consolidation.
Chart Analysis ATS AI Generated: 2026-10-12 07:11 for Informational use only, not trading advice. Terms and Risk Disclosure Copyright © 2026. Algo Trading Systems LLC.