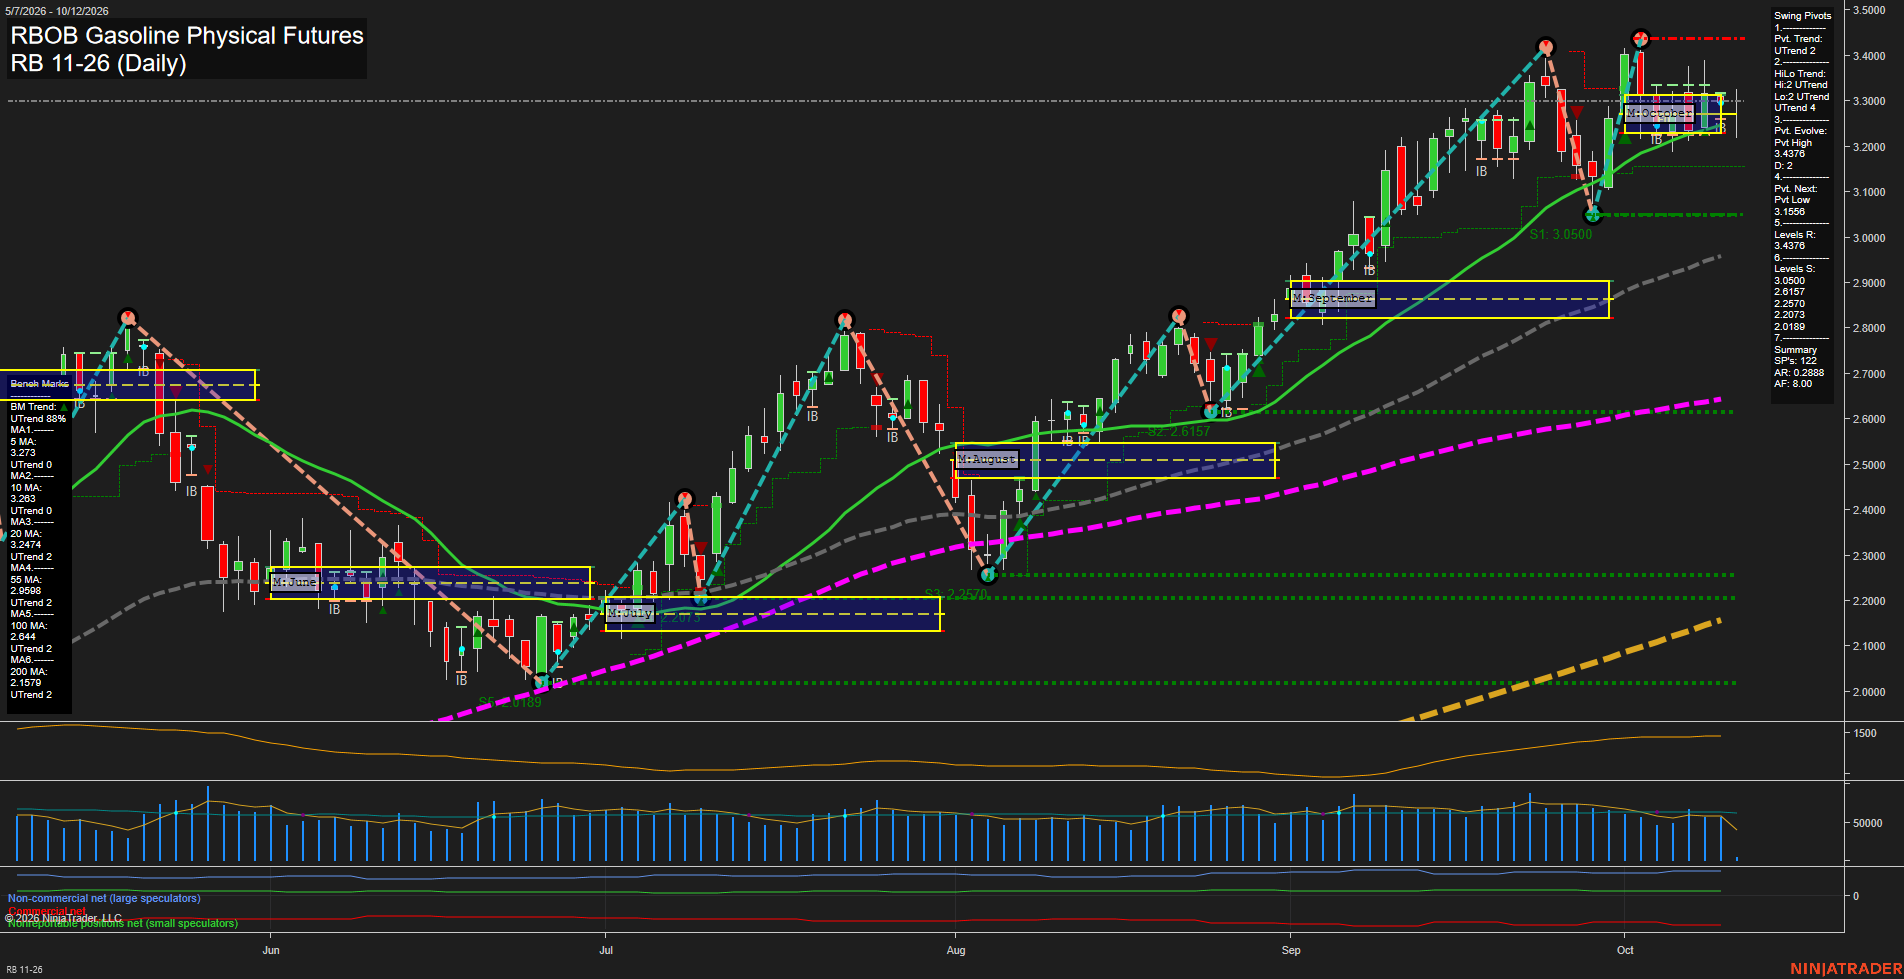
RB RBOB Gasoline Physical Futures Daily Chart Analysis: 2026-Oct-12 07:07 CT
Price Action
- Last: 3.3000,
- Bars: Small,
- Mom: average.
WSFG Weekly
- Short-Term
- WSFG Current: 14%
- F0%/NTZ' Bias: Price Above,
- WSFG Trend: Up.
MSFG Month Oct
- Intermediate-Term
- MSFG Current: 11%
- F0%/NTZ' Bias: Price Above,
- MSFG Trend: Up.
YSFG Year 2026
- Long-Term
- YSFG Current: 242%
- F0%/NTZ' Bias: Price Above,
- YSFG Trend: Up.
Swing Pivots
- (Short-Term) 1. Pvt. Trend: UTrend,
- (Intermediate-Term) 2. HiLo Trend: UTrend,
- 3. Pvt. Evolve: Pvt high 3.4376,
- 4. Pvt. Next: Pvt low 3.1556,
- 5. Levels R: 3.4376,
- 6. Levels S: 3.0500, 2.6157, 2.2570, 2.2073.
Daily Benchmarks
- (Short-Term) 5 Day: 3.273 Up Trend,
- (Short-Term) 10 Day: 3.263 Up Trend,
- (Intermediate-Term) 20 Day: 3.247 Up Trend,
- (Intermediate-Term) 55 Day: 2.958 Up Trend,
- (Long-Term) 100 Day: 2.648 Up Trend,
- (Long-Term) 200 Day: 2.157 Up Trend.
Additional Metrics
Recent Trade Signals
- 12 Oct 2026: Long RB 11-26 @ 3.3003 Signals.USAR-WSFG
- 12 Oct 2026: Short RB 11-26 @ 3.222 Signals.USAR.TR120
- 09 Oct 2026: Long RB 11-26 @ 3.3081 Signals.USAR-MSFG
Overall Rating
- Short-Term: Bullish,
- Intermediate-Term: Bullish,
- Long-Term: Bullish.
Key Insights Summary
Price remains in a broad advancing structure, holding above every benchmark moving average and above the weekly, monthly, and yearly Fib-grid reference areas. The short-term pivot structure is upward, although the latest narrow candles near 3.30 indicate consolidation after the sharp recovery from the 3.1556 pivot low. The 3.4376 swing high is the dominant overhead resistance, while 3.0500 is the nearest structural support. Rising moving-average alignment and higher swing lows preserve the intermediate and long-term bullish trend, while the mixed recent short-term signals reflect a choppy pause beneath the prior high rather than a completed trend reversal.
Chart Analysis ATS AI Generated: 2026-10-12 07:08 for Informational use only, not trading advice. Terms and Risk Disclosure Copyright © 2026. Algo Trading Systems LLC.