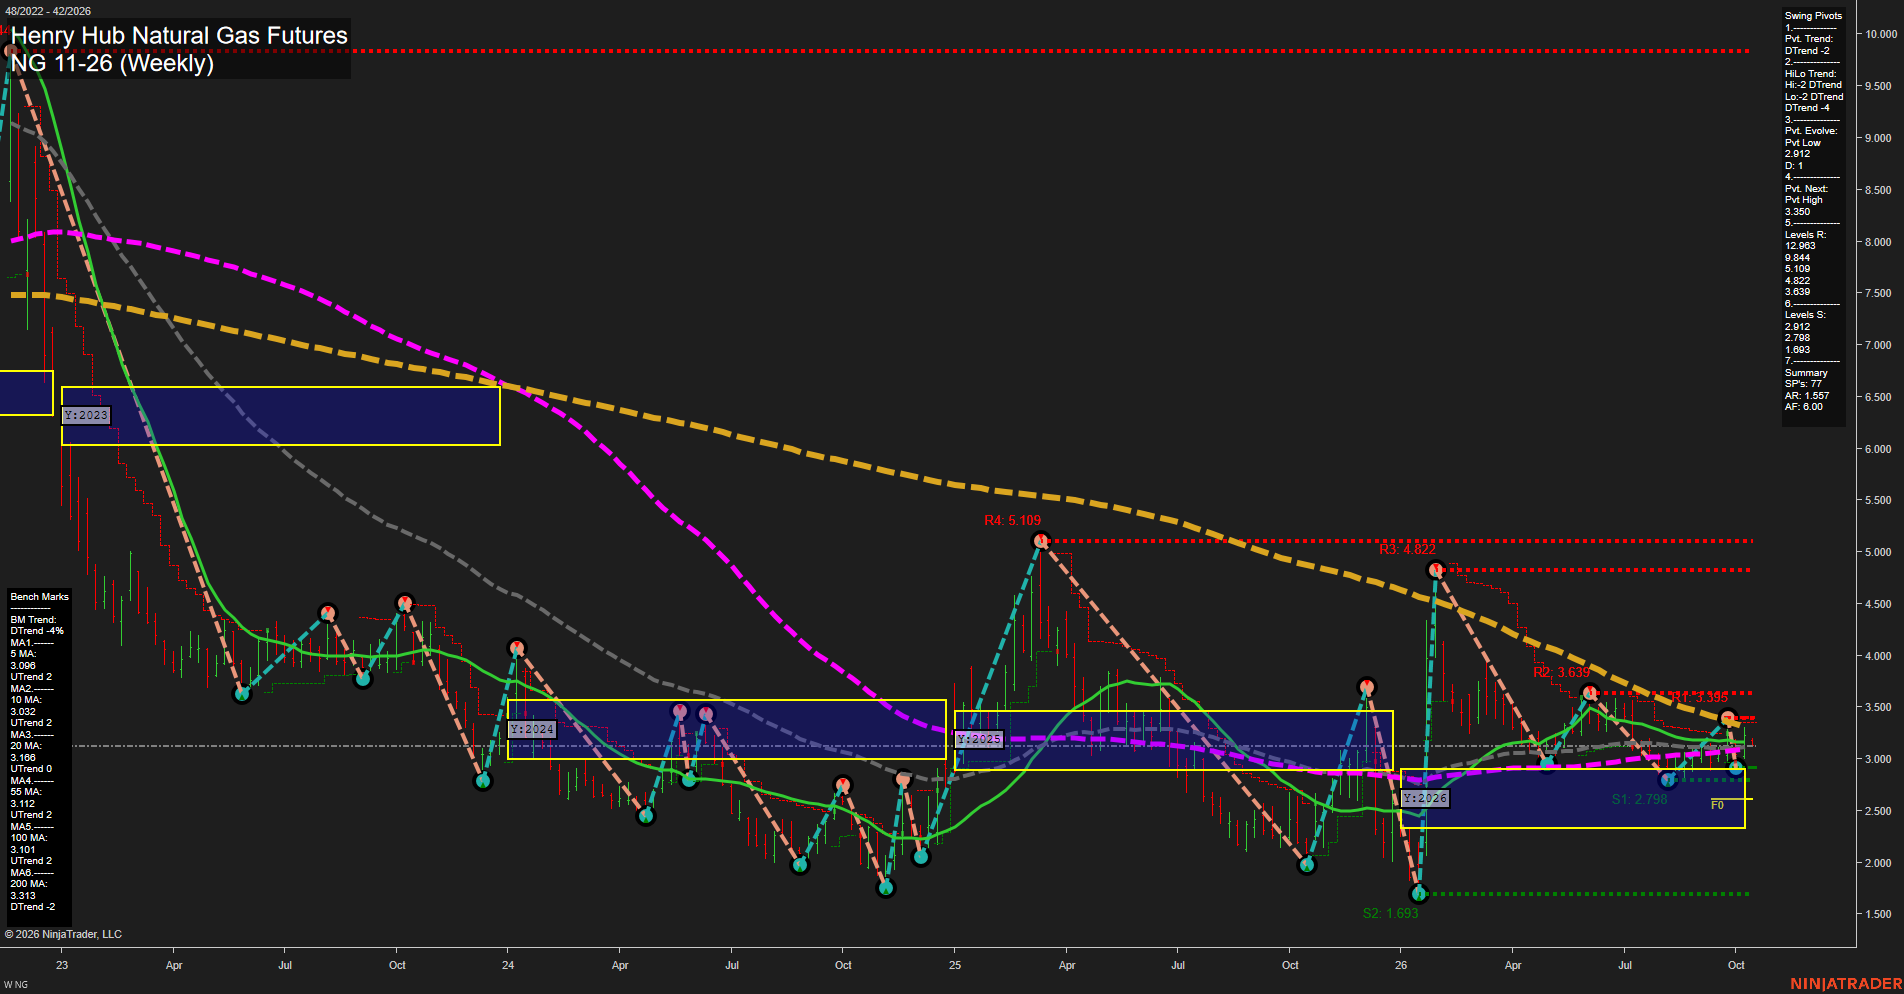
NG Henry Hub Natural Gas Futures Weekly Chart Analysis: 2026-Oct-12 07:06 CT
Price Action
- Last: 3.138,
- Bars: Small,
- Mom: Slow.
WSFG Weekly
- Short-Term
- WSFG Current: -14%
- F0%/NTZ' Bias: Price Below,
- WSFG Trend: Down.
MSFG Month Oct
- Intermediate-Term
- MSFG Current: 32%
- F0%/NTZ' Bias: Price Above,
- MSFG Trend: Up.
YSFG Year 2026
- Long-Term
- YSFG Current: 18%
- F0%/NTZ' Bias: Price Above,
- YSFG Trend: Up.
Swing Pivots
- (Short-Term) 1. Pvt. Trend: DTrend,
- (Intermediate-Term) 2. HiLo Trend: DTrend,
- 3. Pvt. Evolve: Pvt low 2.912,
- 4. Pvt. Next: Pvt high 3.350,
- 5. Levels R: 9.844, 5.109, 4.822, 3.639,
- 6. Levels S: 2.912, 2.798, 1.693.
Weekly Benchmarks
- (Short-Term) 5 Day: 3.099 Up Trend,
- (Short-Term) 10 Day: 3.030 Up Trend,
- (Intermediate-Term) 20 Day: 3.106 Up Trend,
- (Intermediate-Term) 55 Day: 3.112 Up Trend,
- (Long-Term) 100 Day: 3.101 Up Trend,
- (Long-Term) 200 Day: 3.315 Down Trend.
Recent Trade Signals
- 12 Oct 2026: Short NG 11-26 @ 3.138 Signals.USAR-WSFG
Overall Rating
- Short-Term: Bearish,
- Intermediate-Term: Neutral,
- Long-Term: Bullish.
Key Insights Summary
Price is consolidating near the yearly F0% area after a sharp first-quarter recovery and subsequent retracement. Short-term pivot structure remains bearish, with price below the weekly F0% and beneath the 3.350 pivot-reversal level, while small weekly bars reflect slowing momentum and compression. The 2.912 to 2.798 support cluster defines the nearby lower swing range, while 3.350 and 3.639 remain the principal overhead pivot barriers. Monthly and yearly fib-grid positioning remain constructive above their F0% levels, creating a broader upward backdrop beneath a short-term countertrend decline. The rising 5 through 100-period benchmarks show stabilization around 3.10, but the declining 200-period benchmark near 3.315 maintains a longer-cycle overhead trend constraint.
Chart Analysis ATS AI Generated: 2026-10-12 07:06 for Informational use only, not trading advice. Terms and Risk Disclosure Copyright © 2026. Algo Trading Systems LLC.