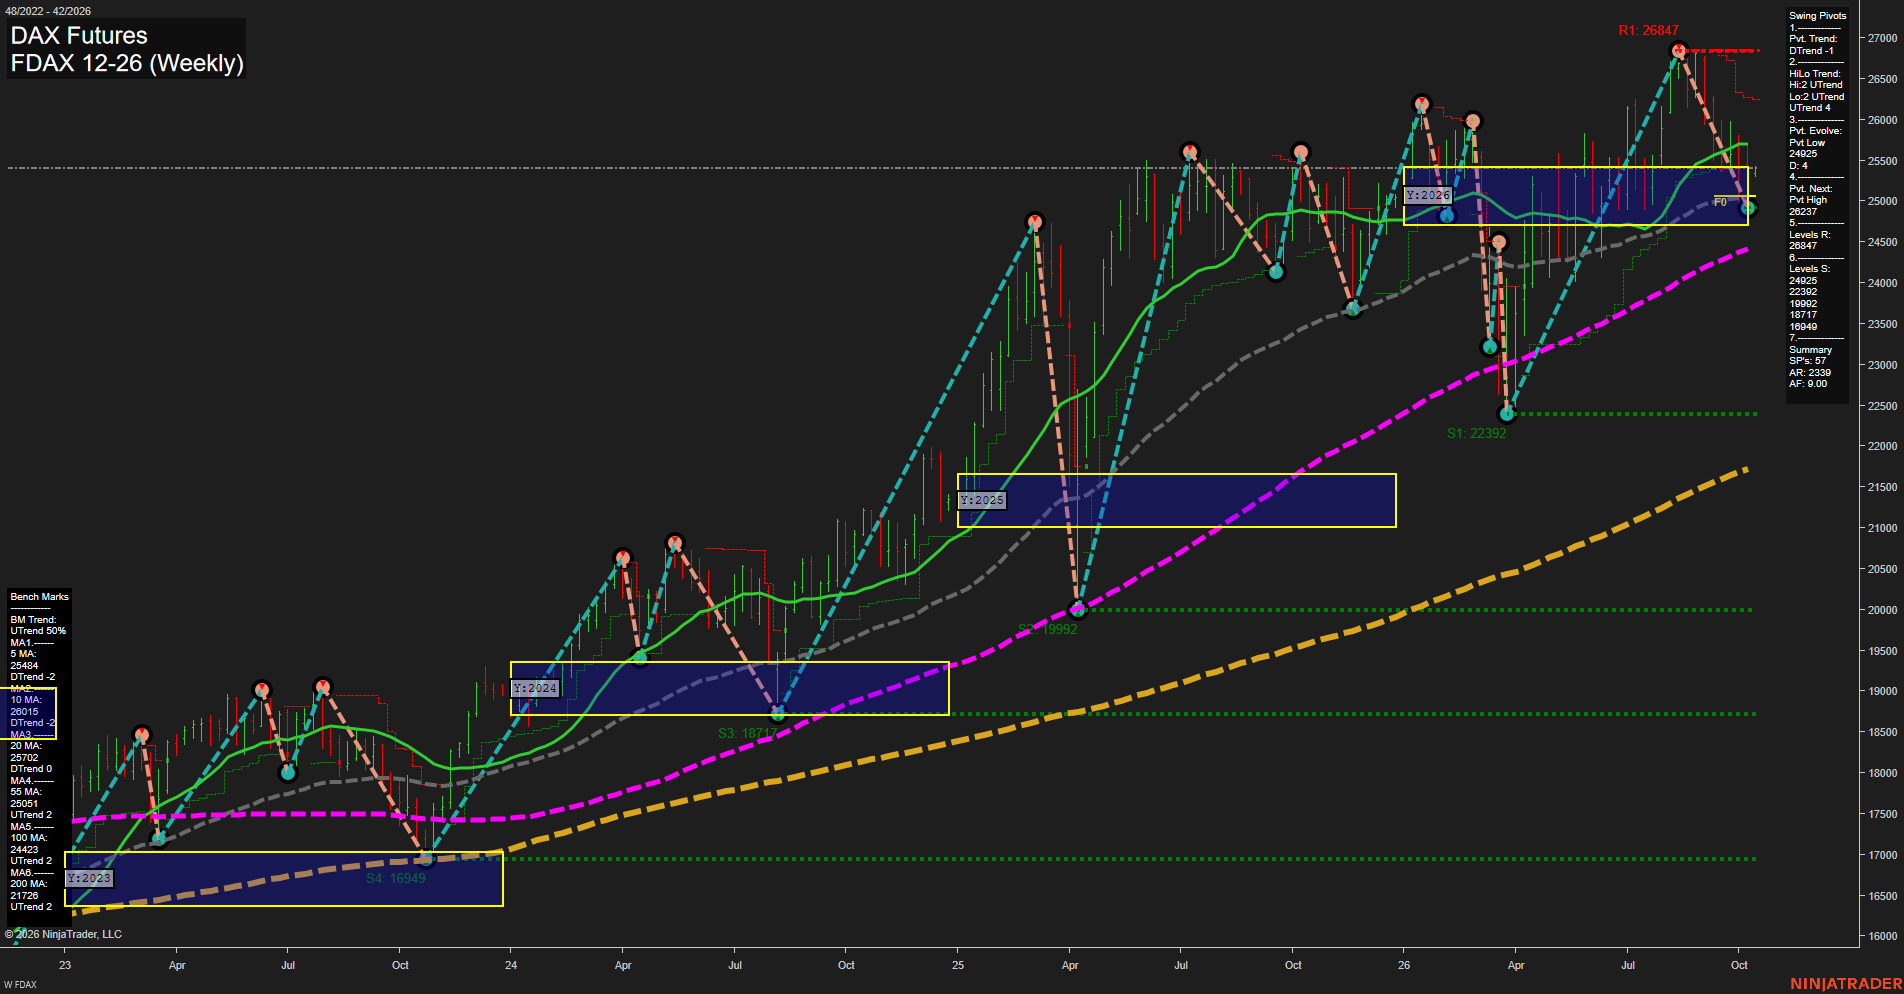
FDAX DAX Futures Weekly Chart Analysis: 2026-Oct-12 07:04 CT
Price Action
- Last: 25448,
- Bars: Medium,
- Mom: fast.
WSFG Weekly
- Short-Term
- WSFG Current: 11%
- F0%/NTZ' Bias: Price Above,
- WSFG Trend: Up.
MSFG Month Oct
- Intermediate-Term
- MSFG Current: 20%
- F0%/NTZ' Bias: Price Above,
- MSFG Trend: Up.
YSFG Year 2026
- Long-Term
- YSFG Current: 10%
- F0%/NTZ' Bias: Price Above,
- YSFG Trend: Up.
Swing Pivots
- (Short-Term) 1. Pvt. Trend: DTrend,
- (Intermediate-Term) 2. HiLo Trend: UTrend,
- 3. Pvt. Evolve: Pvt low 24925,
- 4. Pvt. Next: Pvt high 26237,
- 5. Levels R: 26847,
- 6. Levels S: 24925, 22392, 19992, 18717, 16949.
Weekly Benchmarks
- (Short-Term) 5 Day: 25483 Down Trend,
- (Short-Term) 10 Day: 26015 Down Trend,
- (Intermediate-Term) 20 Day: 25700 Down Trend,
- (Intermediate-Term) 55 Day: 25051 Up Trend,
- (Long-Term) 100 Day: 24423 Up Trend,
- (Long-Term) 200 Day: 21726 Up Trend.
Recent Trade Signals
- 12 Oct 2026: Long FDAX 12-26 @ 25385 Signals.USAR-MSFG
- 09 Oct 2026: Long FDAX 12-26 @ 25278 Signals.USAR.TR120
- 07 Oct 2026: Short FDAX 12-26 @ 25280 Signals.USAR-WSFG
Overall Rating
- Short-Term: Neutral,
- Intermediate-Term: Bullish,
- Long-Term: Bullish.
Key Insights Summary
Price is consolidating near the yearly F0%/NTZ area after a fast retreat from the 26847 swing-high resistance. The short-term pivot sequence remains down and price is below the declining 5-, 10-, and 20-week benchmarks, reflecting a counter-trend pullback. Intermediate and long-term structure remains constructive: the HiLo trend is up, price holds above the rising 55-, 100-, and 200-week benchmarks, and the session fib grids retain upward bias. The 24925 pivot low is the nearest structural support, while 26237 and 26847 define the principal upside pivot and resistance references.
Chart Analysis ATS AI Generated: 2026-10-12 07:04 for Informational use only, not trading advice. Terms and Risk Disclosure Copyright © 2026. Algo Trading Systems LLC.