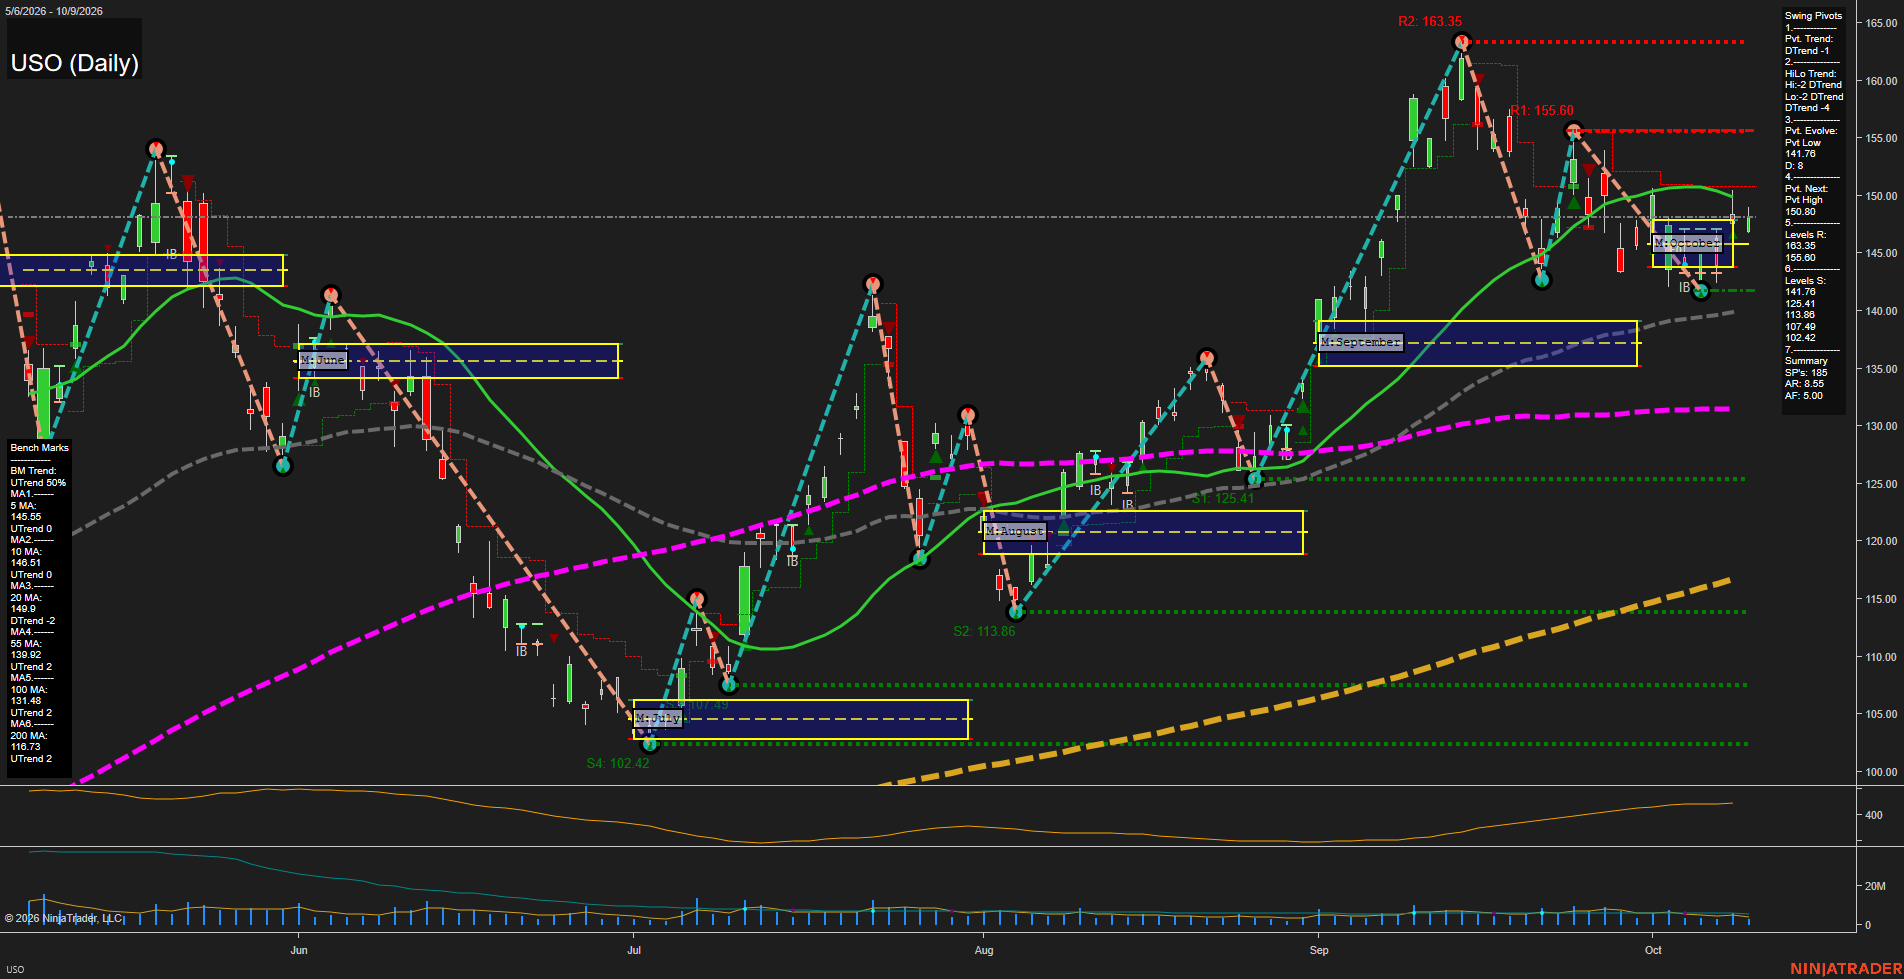
USO United States Oil Fund LP Daily Chart Analysis: 2026-Oct-11 18:09 CT
Price Action
- Last: 148.50,
- Bars: Medium,
- Mom: Average.
WSFG Weekly
- Short-Term
- WSFG Current: NA%
- F0%/NTZ' Bias: Price Neutral,
- WSFG Trend: Neutral.
MSFG Month Oct
- Intermediate-Term
- MSFG Current: NA%
- F0%/NTZ' Bias: Price Bullish,
- MSFG Trend: Bullish.
YSFG Year 2026
- Long-Term
- YSFG Current: NA%
- F0%/NTZ' Bias: Price Neutral,
- YSFG Trend: Neutral.
Swing Pivots
- (Short-Term) 1. Pvt. Trend: DTrend,
- (Intermediate-Term) 2. HiLo Trend: DTrend,
- 3. Pvt. Evolve: Pvt low 141.76,
- 4. Pvt. Next: Pvt high 150.80,
- 5. Levels R: 163.35, 155.60,
- 6. Levels S: 141.76, 125.41, 113.86, 107.49, 102.42.
Daily Benchmarks
- (Short-Term) 5 Day: 145.55 Up Trend,
- (Short-Term) 10 Day: 146.51 Up Trend,
- (Intermediate-Term) 20 Day: 149.40 Down Trend,
- (Intermediate-Term) 55 Day: 139.92 Up Trend,
- (Long-Term) 100 Day: 131.48 Up Trend,
- (Long-Term) 200 Day: 116.73 Up Trend.
Additional Metrics
- ATR: 6.55,
- VOLMA: 1000000.
Overall Rating
- Short-Term: Neutral,
- Intermediate-Term: Bullish,
- Long-Term: Bullish.
Key Insights Summary
USO reflects a broad higher-timeframe recovery structure above its rising 55-, 100-, and 200-day benchmarks, while the shorter swing cycle remains corrective after rejection from the 155.60 pivot resistance area. Price has rebounded from the 141.76 pivot low and reclaimed the rising 5- and 10-day averages, but remains beneath the declining 20-day benchmark at 149.40 and the 150.80 next-pivot threshold. The October monthly grid is being approached from above, characterizing the current action as a rebound within a short-term consolidation range. A sustained sequence of higher lows above 141.76 would preserve the broader bullish recovery structure; failure of that pivot would shift focus toward the substantially lower 125.41 support zone. Futures-linked energy pricing remains sensitive to inventory, production, geopolitical, and seasonal demand headlines, which can amplify the approximately 6.55-point ATR swing environment.
Chart Analysis ATS AI Generated: 2026-10-11 18:09 for Informational use only, not trading advice. Terms and Risk Disclosure Copyright © 2026. Algo Trading Systems LLC.