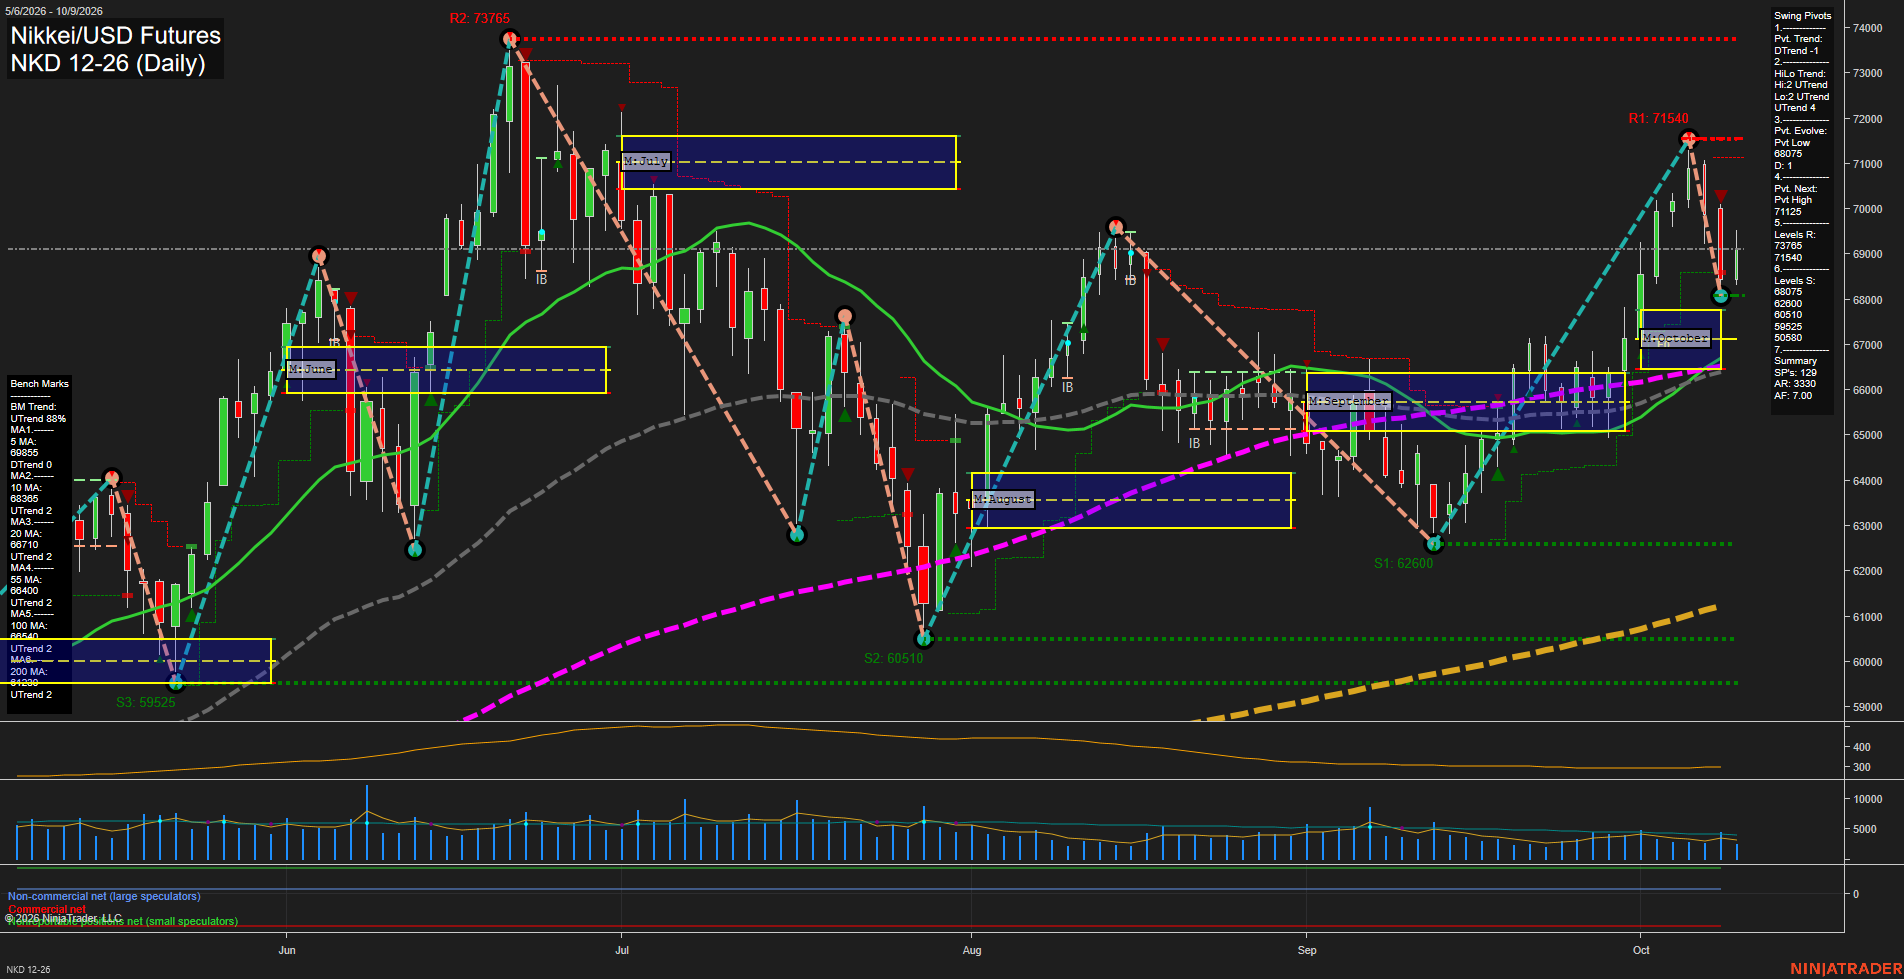
NKD Nikkei/USD Futures Daily Chart Analysis: 2026-Oct-11 18:05 CT
Price Action
- Last: 69030,
- Bars: Medium,
- Mom: average.
WSFG Weekly
- Short-Term
- WSFG Current: 1%
- F0%/NTZ' Bias: Price Above,
- WSFG Trend: Up.
MSFG Month Oct
- Intermediate-Term
- MSFG Current: 5%
- F0%/NTZ' Bias: Price Above,
- MSFG Trend: Up.
YSFG Year 2026
- Long-Term
- YSFG Current: 219%
- F0%/NTZ' Bias: Price Above,
- YSFG Trend: Up.
Swing Pivots
- (Short-Term) 1. Pvt. Trend: DTrend,
- (Intermediate-Term) 2. HiLo Trend: UTrend,
- 3. Pvt. Evolve: Pvt low 68075,
- 4. Pvt. Next: Pvt high 71125,
- 5. Levels R: 73765, 71540,
- 6. Levels S: 68075, 62600, 60510, 59525.
Daily Benchmarks
- (Short-Term) 5 Day: 69855 Down Trend,
- (Short-Term) 10 Day: 68365 Up Trend,
- (Intermediate-Term) 20 Day: 68710 Up Trend,
- (Intermediate-Term) 55 Day: 68400 Up Trend,
- (Long-Term) 100 Day: 68545 Up Trend,
- (Long-Term) 200 Day: 61240 Up Trend.
Additional Metrics
Recent Trade Signals
- 08 Oct 2026: Short NKD 12-26 @ 69475 Signals.USAR-WSFG
- 07 Oct 2026: Short NKD 12-26 @ 70275 Signals.USAR.TR120
Overall Rating
- Short-Term: Bearish,
- Intermediate-Term: Bullish,
- Long-Term: Bullish.
Key Insights Summary
NKD remains in a broad bullish structure, holding above the rising 10, 20, 55, 100, and 200-day benchmarks and above the October monthly F0% zone. Short-term action is corrective following rejection from the 71540 swing resistance area, with the pivot trend shifting to DTrend and the 5-day benchmark turning lower. Price has rebounded from the 68075 pivot-low support, creating a short-term recovery within a broader higher-low sequence. The 71125 pivot-next level and 71540 resistance define the upper swing reference, while 68075 is the immediate structural support. Volatility remains elevated relative to the recent consolidation, while volume is moderate and does not yet indicate a decisive expansion phase.
Chart Analysis ATS AI Generated: 2026-10-11 18:06 for Informational use only, not trading advice. Terms and Risk Disclosure Copyright © 2026. Algo Trading Systems LLC.