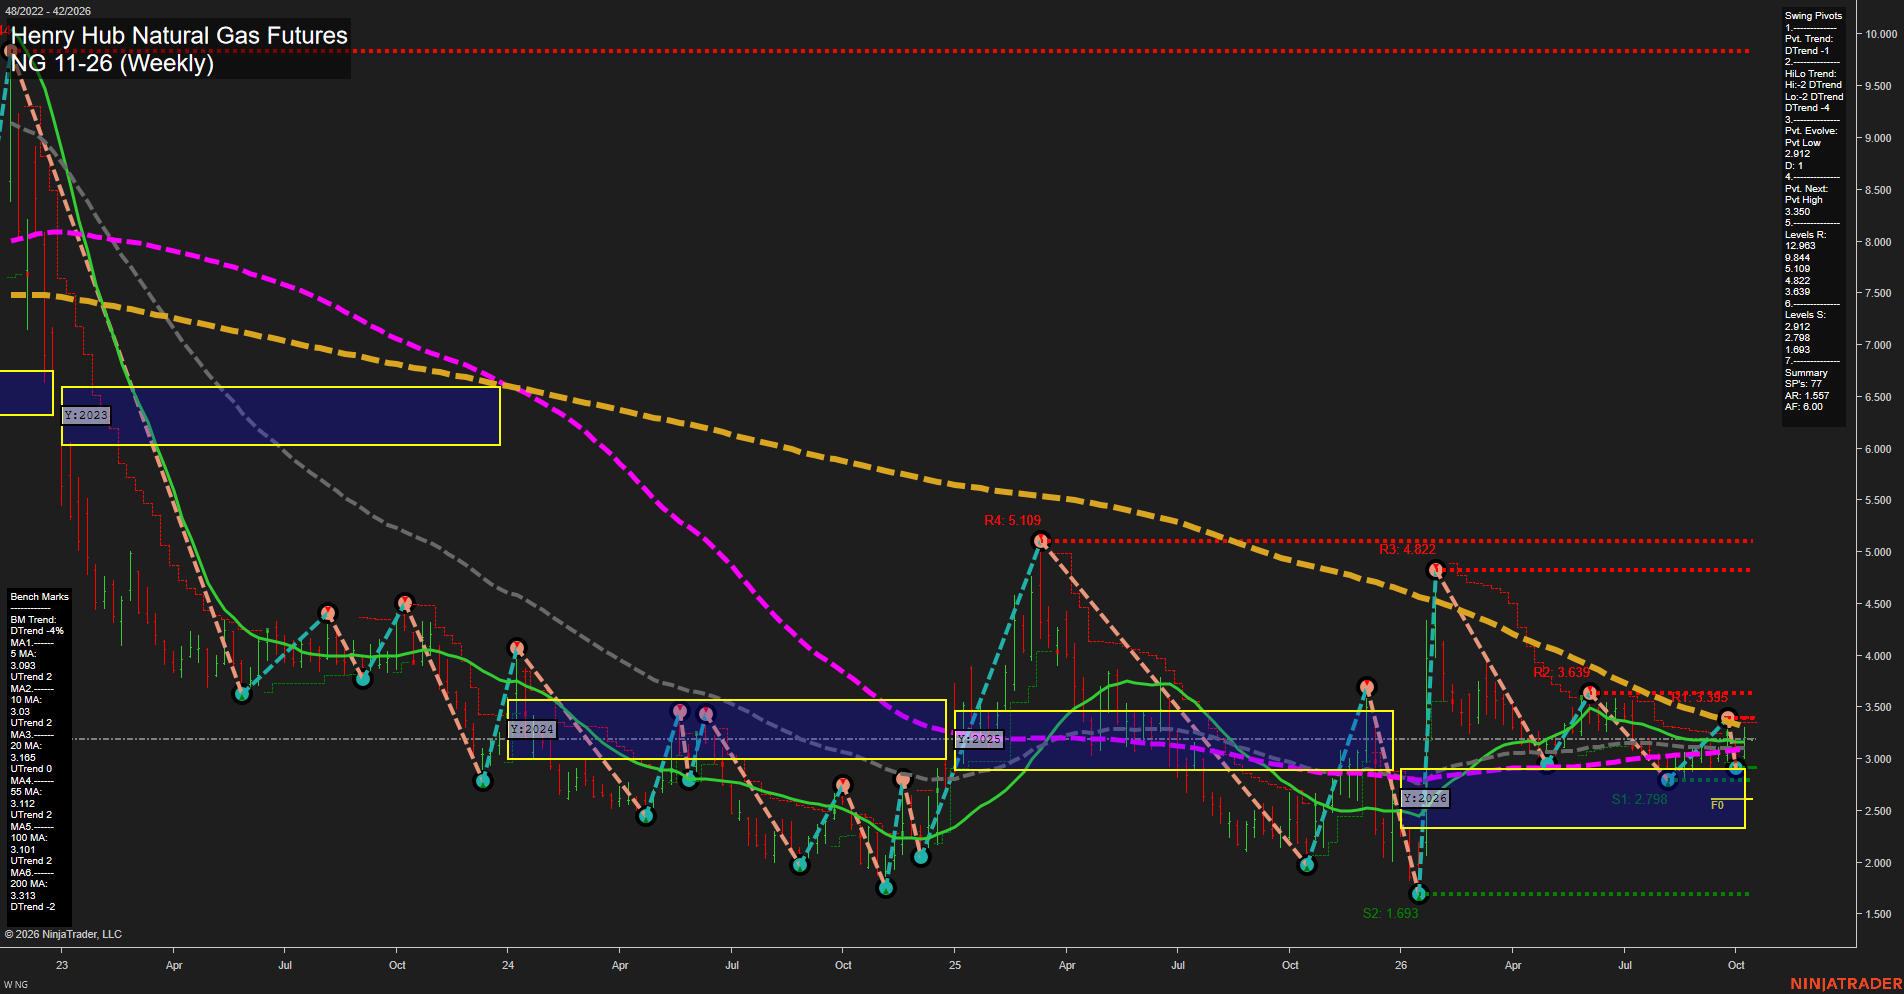
NG Henry Hub Natural Gas Futures Weekly Chart Analysis: 2026-Oct-11 18:05 CT
Price Action
- Last: 3.095,
- Bars: Small,
- Mom: slow.
WSFG Weekly
- Short-Term
- WSFG Current: 75%
- F0%/NTZ' Bias: Price Above,
- WSFG Trend: Up.
MSFG Month Oct
- Intermediate-Term
- MSFG Current: 46%
- F0%/NTZ' Bias: Price Above,
- MSFG Trend: Up.
YSFG Year 2026
- Long-Term
- YSFG Current: 20%
- F0%/NTZ' Bias: Price Above,
- YSFG Trend: Up.
Swing Pivots
- (Short-Term) 1. Pvt. Trend: DTrend,
- (Intermediate-Term) 2. HiLo Trend: DTrend,
- 3. Pvt. Evolve: Pvt low 2.912,
- 4. Pvt. Next: Pvt high 3.350,
- 5. Levels R: 12.963, 9.844, 5.109, 4.822, 3.639,
- 6. Levels S: 2.912, 2.798, 1.693.
Weekly Benchmarks
- (Short-Term) 5 Day: 3.097 Up Trend,
- (Short-Term) 10 Day: 3.030 Up Trend,
- (Intermediate-Term) 20 Day: 3.105 Up Trend,
- (Intermediate-Term) 55 Day: 3.112 Up Trend,
- (Long-Term) 100 Day: 3.101 Up Trend,
- (Long-Term) 200 Day: 3.315 Down Trend.
Overall Rating
- Short-Term: Neutral,
- Intermediate-Term: Neutral,
- Long-Term: Bullish.
Key Insights Summary
Price is compressing near the clustered 5, 10, 20, 55, and 100-week benchmarks around 3.03 to 3.11, reflecting a slow-momentum consolidation. Weekly and monthly Fib-grid structures remain positive above F0%, while the pivot sequence remains in a DTrend and defines 3.350 as the reversal threshold for a new pivot high. The 2.912 and 2.798 supports frame the current range, with 3.639 the nearest larger pivot resistance. The yearly structure remains upward, although price remains below the declining 200-week benchmark at 3.315, preserving a broader overhead resistance zone.
Chart Analysis ATS AI Generated: 2026-10-11 18:05 for Informational use only, not trading advice. Terms and Risk Disclosure Copyright © 2026. Algo Trading Systems LLC.