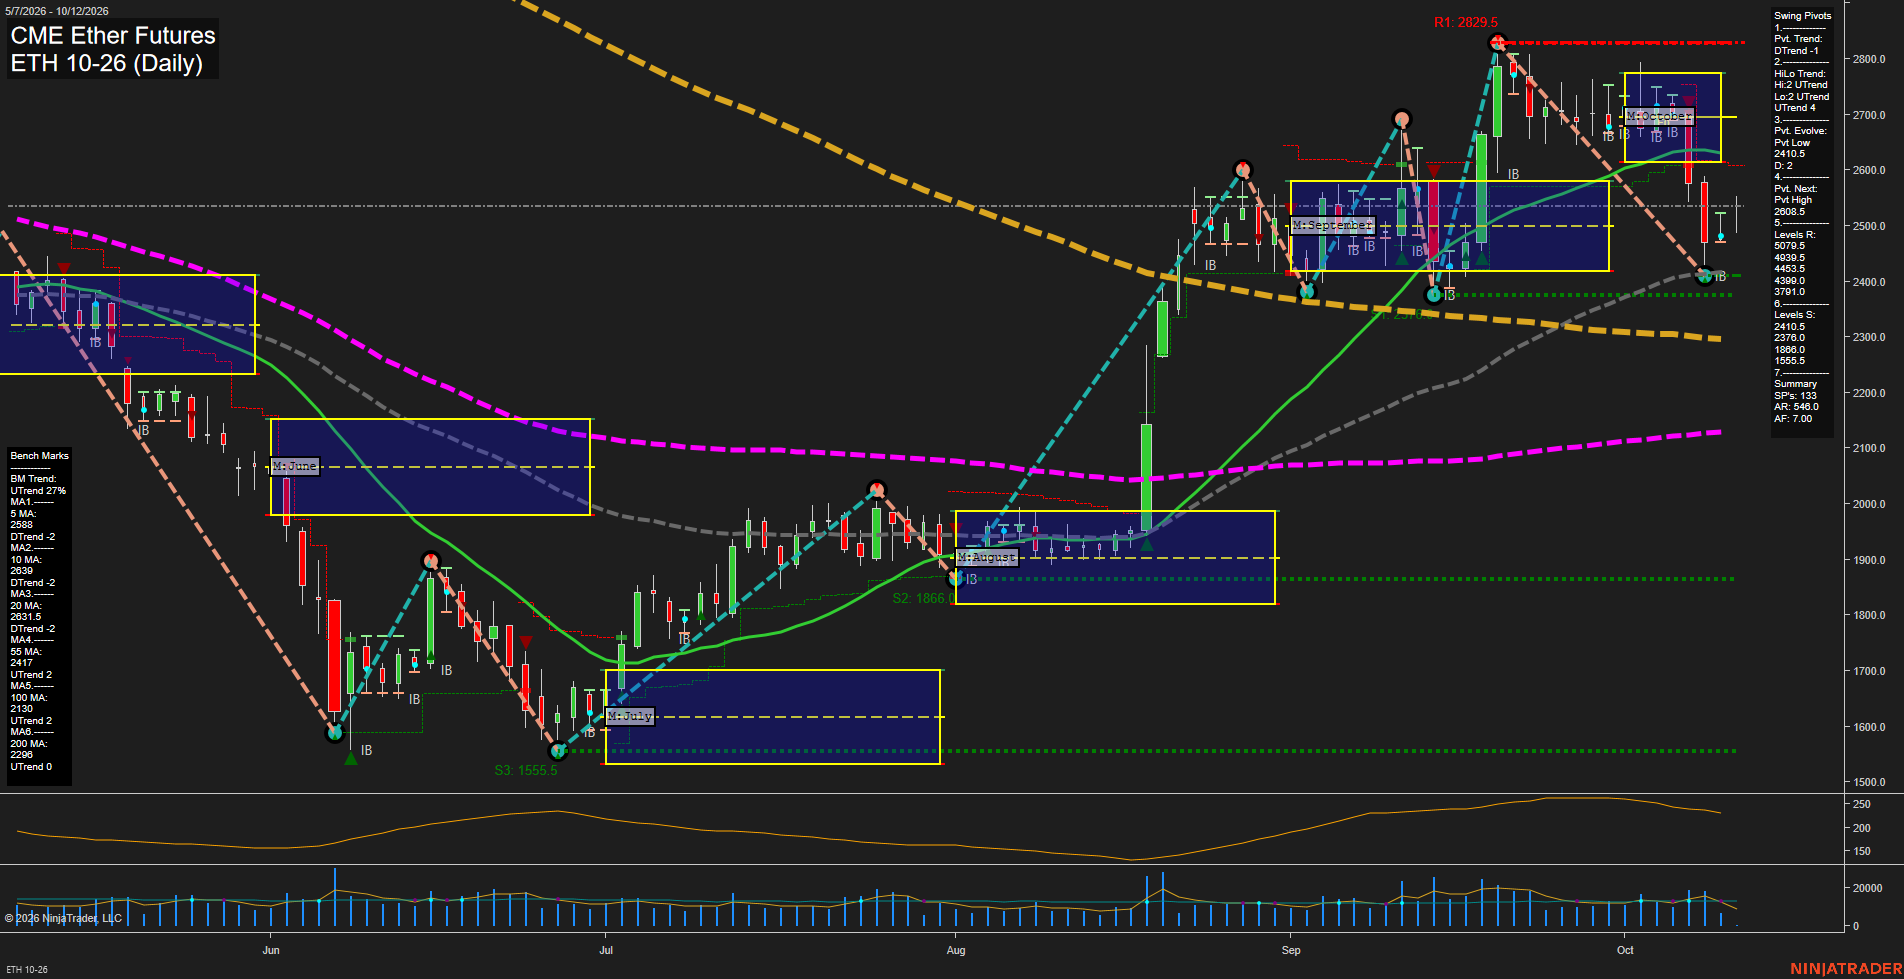
ETH CME Ether Futures Daily Chart Analysis: 2026-Oct-11 18:03 CT
Price Action
- Last: 2495,
- Bars: Small,
- Mom: Slow.
WSFG Weekly
- Short-Term
- WSFG Current: 11%
- F0%/NTZ' Bias: Price Above,
- WSFG Trend: Up.
MSFG Month Oct
- Intermediate-Term
- MSFG Current: -29%
- F0%/NTZ' Bias: Price Below,
- MSFG Trend: Down.
YSFG Year 2026
- Long-Term
- YSFG Current: -20%
- F0%/NTZ' Bias: Price Below,
- YSFG Trend: Down.
Swing Pivots
- (Short-Term) 1. Pvt. Trend: DTrend,
- (Intermediate-Term) 2. HiLo Trend: UTrend,
- 3. Pvt. Evolve: Pvt low 2410.5,
- 4. Pvt. Next: Pvt high 2608.5,
- 5. Levels R: 5979.5, 4939.5, 4543.5, 3990.0, 3791.0,
- 6. Levels S: 2410.5, 2376.0, 1866.0, 1555.5.
Daily Benchmarks
- (Short-Term) 5 Day: 2588 Down Trend,
- (Short-Term) 10 Day: 2639 Down Trend,
- (Intermediate-Term) 20 Day: 2631.5 Down Trend,
- (Intermediate-Term) 55 Day: 2417 Up Trend,
- (Long-Term) 100 Day: 2130 Up Trend,
- (Long-Term) 200 Day: 2298 Up Trend.
Additional Metrics
Recent Trade Signals
- 11 Oct 2026: Long ETH 10-26 @ 2536 Signals.USAR-WSFG
- 08 Oct 2026: Short ETH 10-26 @ 2438 Signals.USAR.TR720
- 07 Oct 2026: Short ETH 10-26 @ 2616.5 Signals.USAR-MSFG
Overall Rating
- Short-Term: Bearish,
- Intermediate-Term: Neutral,
- Long-Term: Neutral.
Key Insights Summary
ETH futures are consolidating near 2495 after a sharp rejection from the late-September/early-October high area. The short-term pivot trend and 5-, 10-, and 20-day benchmarks remain down, showing that the rebound from 2410.5 has not yet restored near-term upside structure. Weekly grid positioning remains above its F0% level, while the monthly and yearly grids remain below theirs, creating a countertrend short-term bounce inside weaker intermediate and long-term grid conditions. The intermediate HiLo structure and rising 55-, 100-, and 200-day averages preserve the broader recovery base, but price action remains choppy beneath the 2608.5 pivot-reversal level and well below 2829.5 major overhead resistance. The 2410.5 and 2376.0 support band defines the recent pullback floor, with 1866.0 representing the larger structural support beneath the current range.
Chart Analysis ATS AI Generated: 2026-10-11 18:03 for Informational use only, not trading advice. Terms and Risk Disclosure Copyright © 2026. Algo Trading Systems LLC.