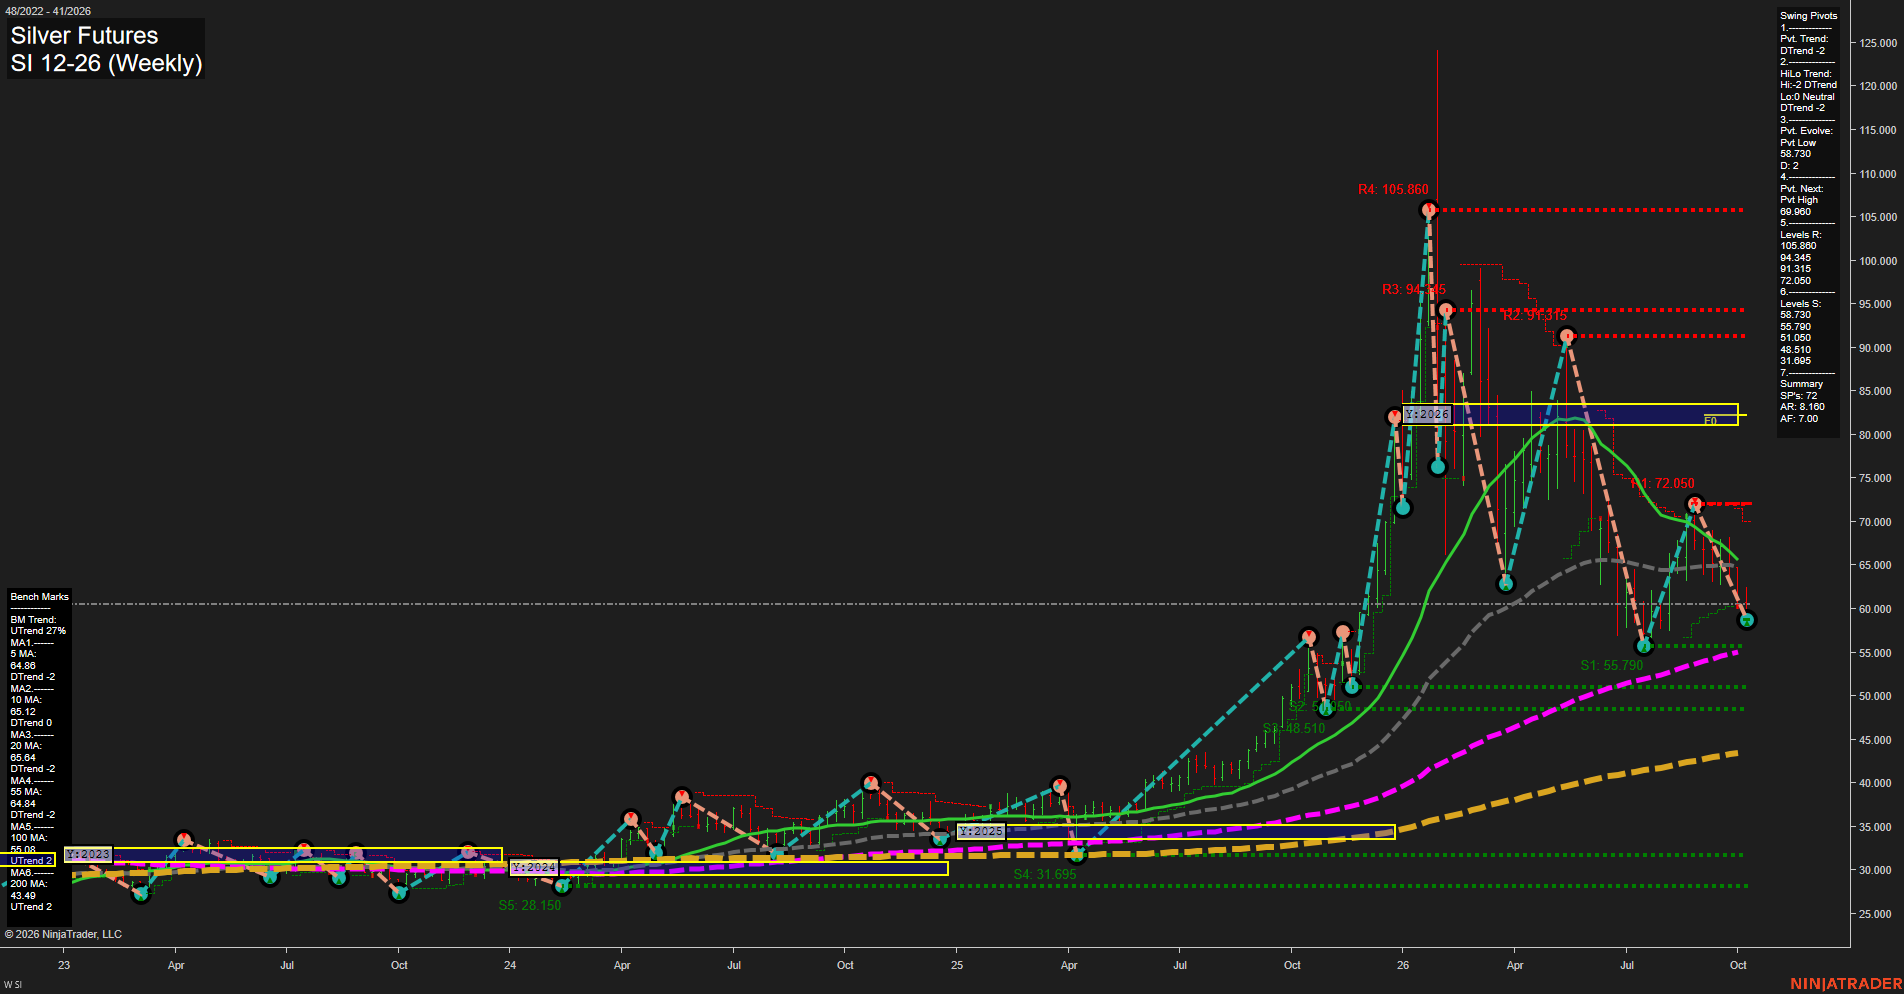
SI Silver Futures Weekly Chart Analysis: 2026-Oct-09 07:09 CT
Price Action
- Last: 58.730,
- Bars: Large,
- Mom: fast.
WSFG Weekly
- Short-Term
- WSFG Current: 1%
- F0%/NTZ' Bias: Price Above,
- WSFG Trend: Up.
MSFG Month Oct
- Intermediate-Term
- MSFG Current: -6%
- F0%/NTZ' Bias: Price Below,
- MSFG Trend: Down.
YSFG Year 2026
- Long-Term
- YSFG Current: -177%
- F0%/NTZ' Bias: Price Below,
- YSFG Trend: Down.
Swing Pivots
- (Short-Term) 1. Pvt. Trend: DTrend,
- (Intermediate-Term) 2. HiLo Trend: DTrend,
- 3. Pvt. Evolve: Pvt low 58.730,
- 4. Pvt. Next: Pvt high 69.960,
- 5. Levels R: 105.860, 94.345, 91.315, 72.050,
- 6. Levels S: 58.790, 55.790, 51.050, 48.510, 31.695.
Weekly Benchmarks
- (Short-Term) 5 Day: 64.860 Down Trend,
- (Short-Term) 10 Day: 65.120 Down Trend,
- (Intermediate-Term) 20 Day: 65.640 Down Trend,
- (Intermediate-Term) 55 Day: 64.840 Down Trend,
- (Long-Term) 100 Day: 55.030 Up Trend,
- (Long-Term) 200 Day: 43.460 Up Trend.
Recent Trade Signals
- 09 Oct 2026: Long SI 12-26 @ 60.555 Signals.USAR.TR120
- 08 Oct 2026: Short SI 12-26 @ 59.495 Signals.USAR-MSFG
- 07 Oct 2026: Short SI 12-26 @ 59.875 Signals.USAR-WSFG
Overall Rating
- Short-Term: Bearish,
- Intermediate-Term: Bearish,
- Long-Term: Neutral.
Key Insights Summary
Price is retracing sharply from the 72.050 pivot high and remains beneath the declining 5, 10, 20, and 55 period benchmarks, confirming fast bearish weekly momentum. The active pivot structure is DTrend, with 58.790 immediately overhead as a pivot level and 55.790, 51.050, and 48.510 defining the lower support sequence. The broader structure remains mixed: price is below the yearly Fib center region and the yearly grid remains down, while the rising 100 and 200 period averages preserve a constructive longer-term base beneath the current correction.
Chart Analysis ATS AI Generated: 2026-10-09 07:09 for Informational use only, not trading advice. Terms and Risk Disclosure Copyright © 2026. Algo Trading Systems LLC.