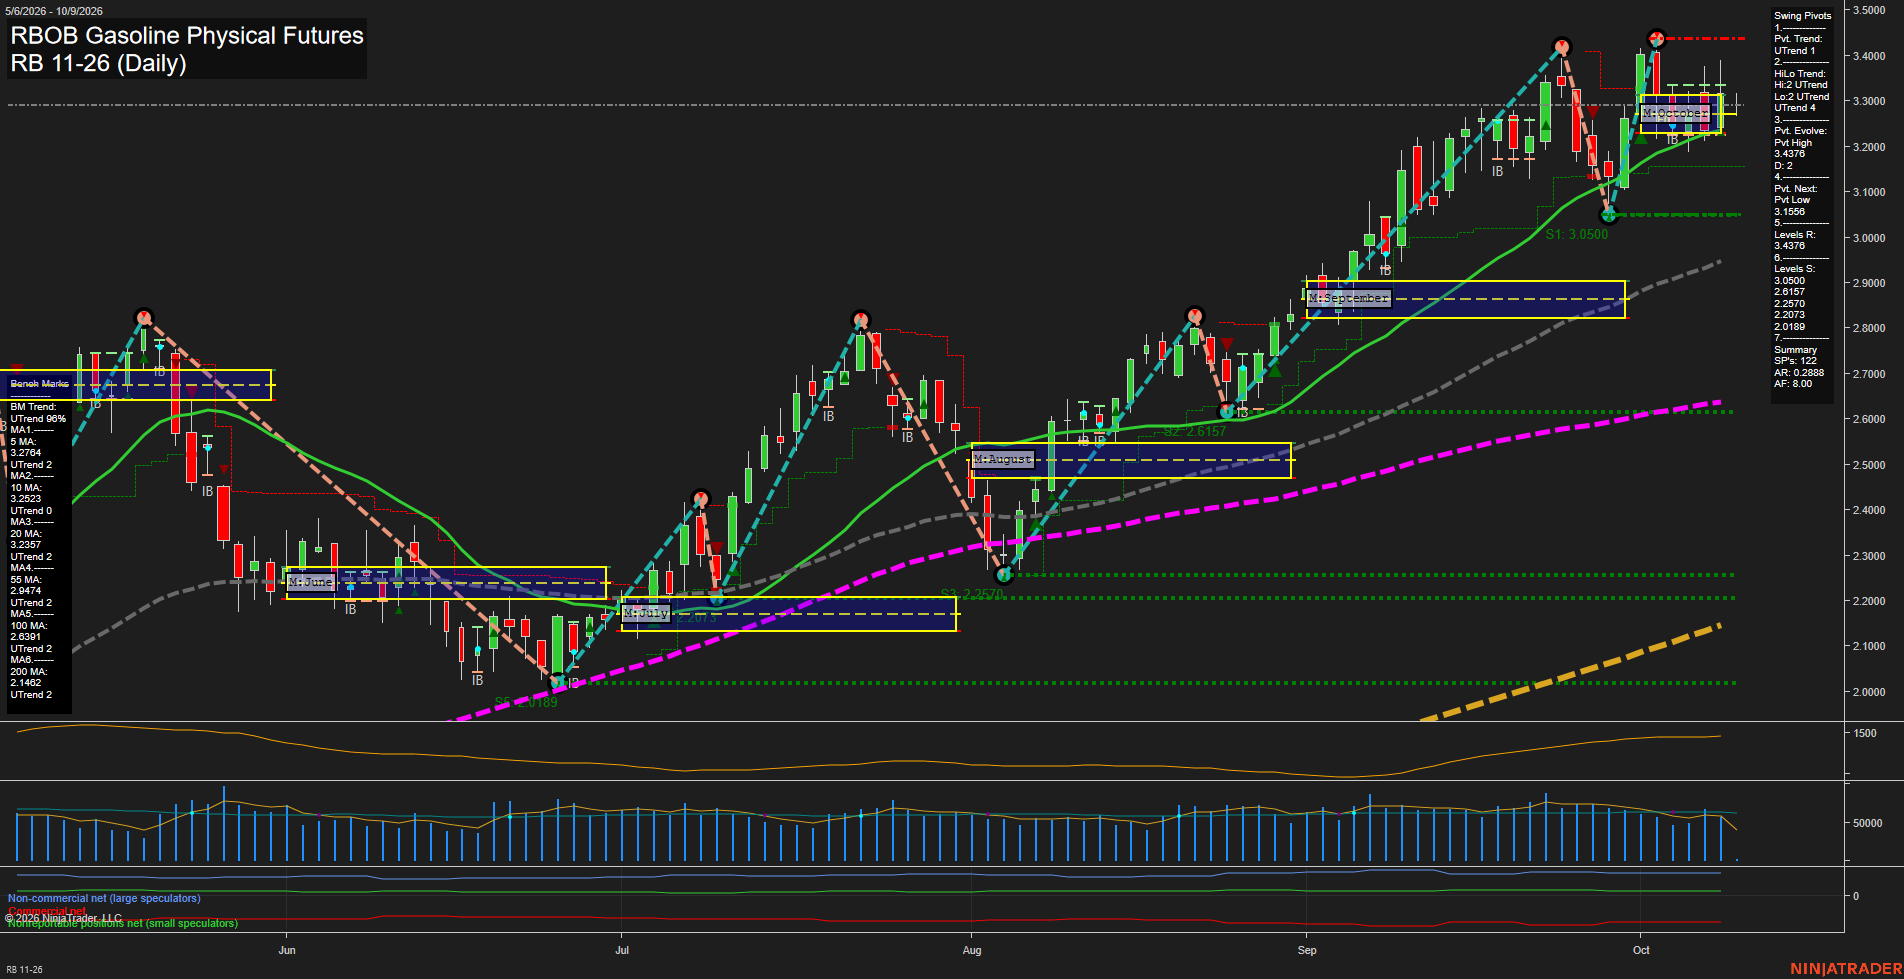
RB RBOB Gasoline Physical Futures Daily Chart Analysis: 2026-Oct-09 07:08 CT
Price Action
- Last: 3.2888,
- Bars: Small,
- Mom: Slow.
WSFG Weekly
- Short-Term
- WSFG Current: -8%
- F0%/NTZ' Bias: Price Below,
- WSFG Trend: Down.
MSFG Month Oct
- Intermediate-Term
- MSFG Current: 7%
- F0%/NTZ' Bias: Price Above,
- MSFG Trend: Up.
YSFG Year 2026
- Long-Term
- YSFG Current: 240%
- F0%/NTZ' Bias: Price Above,
- YSFG Trend: Up.
Swing Pivots
- (Short-Term) 1. Pvt. Trend: UTrend,
- (Intermediate-Term) 2. HiLo Trend: UTrend,
- 3. Pvt. Evolve: Pvt high 3.4376,
- 4. Pvt. Next: Pvt low 3.1556,
- 5. Levels R: 3.4376,
- 6. Levels S: 3.0500, 2.6157, 2.2570, 2.2030, 2.0189.
Daily Benchmarks
- (Short-Term) 5 Day: 3.2764 Up Trend,
- (Short-Term) 10 Day: 3.2523 Up Trend,
- (Intermediate-Term) 20 Day: 3.2537 Up Trend,
- (Intermediate-Term) 55 Day: 2.9474 Up Trend,
- (Long-Term) 100 Day: 2.6189 Up Trend,
- (Long-Term) 200 Day: 2.1442 Up Trend.
Additional Metrics
Recent Trade Signals
- 09 Oct 2026: Long RB 11-26 @ 3.3081 Signals.USAR-MSFG
- 09 Oct 2026: Short RB 11-26 @ 3.2821 Signals.USAR-WSFG
- 08 Oct 2026: Long RB 11-26 @ 3.3425 Signals.USAR.TR120
Overall Rating
- Short-Term: Neutral,
- Intermediate-Term: Bullish,
- Long-Term: Bullish.
Key Insights Summary
Price remains in a broad higher-high and higher-low structure, supported by an aligned rising 20-, 55-, 100-, and 200-day benchmark stack. The October decline from the 3.4376 swing high has transitioned into a tight consolidation above the rising 20-day average and above the monthly F0% area, while the weekly grid remains negative. This creates a short-term countertrend/choppy condition within a still-positive intermediate and long-term advance. The 3.4376 pivot high defines the principal overhead resistance, while 3.1556 is the pivot reversal level and 3.0500 is the major nearby swing support.
Chart Analysis ATS AI Generated: 2026-10-09 07:08 for Informational use only, not trading advice. Terms and Risk Disclosure Copyright © 2026. Algo Trading Systems LLC.