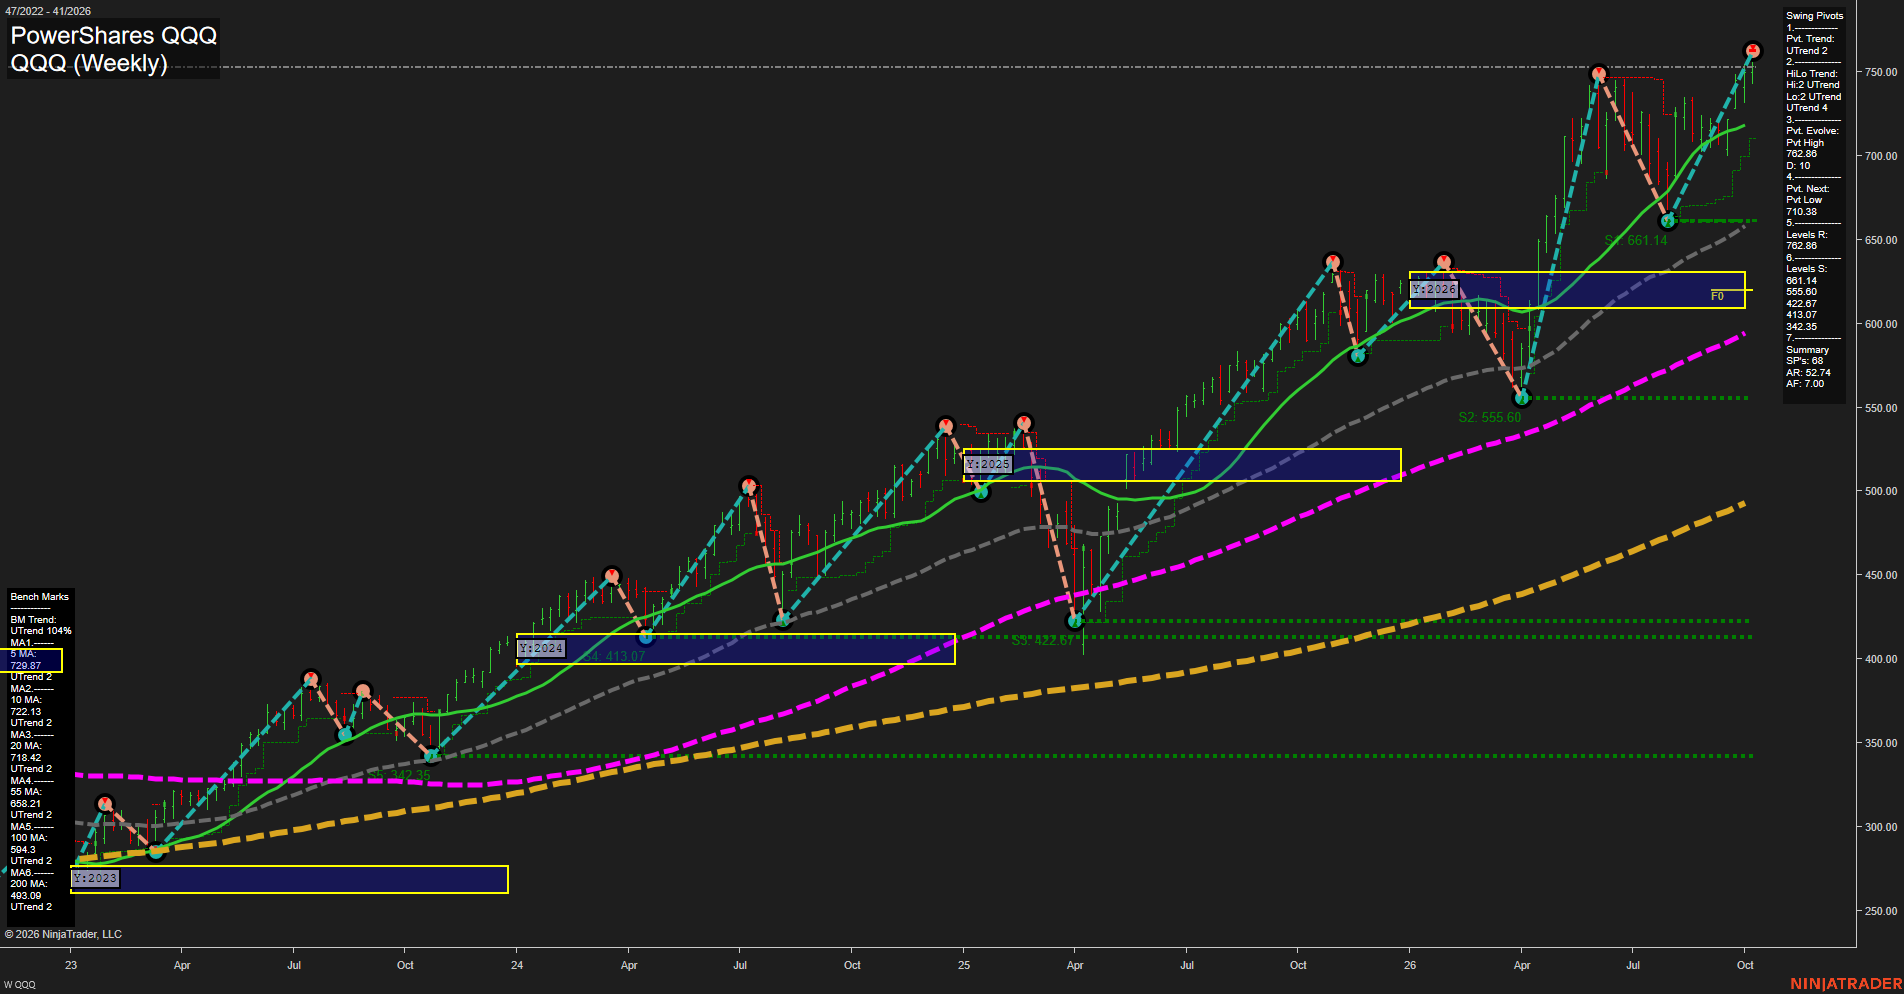
QQQ PowerShares QQQ Weekly Chart Analysis: 2026-Oct-09 07:08 CT
Price Action
- Last: 757.02,
- Bars: Small,
- Mom: fast.
WSFG Weekly
- Short-Term
- WSFG Current: NA%
- F0%/NTZ' Bias: Price Neutral,
- WSFG Trend: Neutral.
MSFG Month Oct
- Intermediate-Term
- MSFG Current: NA%
- F0%/NTZ' Bias: Price Neutral,
- MSFG Trend: Neutral.
YSFG Year 2026
- Long-Term
- YSFG Current: NA%
- F0%/NTZ' Bias: Price Above NTZ,
- YSFG Trend: Bullish.
Swing Pivots
- (Short-Term) 1. Pvt. Trend: UTrend,
- (Intermediate-Term) 2. HiLo Trend: UTrend,
- 3. Pvt. Evolve: Pvt high 762.88,
- 4. Pvt. Next: Pvt low 710.38,
- 5. Levels R: 762.88,
- 6. Levels S: 661.14, 555.60, 422.87, 413.07, 342.35.
Weekly Benchmarks
- (Short-Term) 5 Day: 729.91 Up Trend,
- (Short-Term) 10 Day: 722.13 Up Trend,
- (Intermediate-Term) 20 Day: 718.42 Up Trend,
- (Intermediate-Term) 55 Day: 658.21 Up Trend,
- (Long-Term) 100 Day: 594.30 Up Trend,
- (Long-Term) 200 Day: 493.09 Up Trend.
Overall Rating
- Short-Term: Bullish,
- Intermediate-Term: Bullish,
- Long-Term: Bullish.
Key Insights Summary
QQQ remains in a broad, mature upside swing structure from a futures swing-trader perspective. Price is pressing the 762.88 pivot-high resistance area while holding decisively above all rising benchmark averages, confirming strong multi-timeframe participation. The 710.38 pivot-low reversal threshold defines the nearer swing structure, while 661.14 is the principal lower support shelf. The current advance is extended above the yearly NTZ and recent bars have narrowed near highs, reflecting consolidation beneath resistance rather than a confirmed reversal. A sustained move through the pivot high would maintain trend-continuation character; failure from that area would frame a countertrend retracement within an otherwise bullish intermediate and long-term structure.
Chart Analysis ATS AI Generated: 2026-10-09 07:08 for Informational use only, not trading advice. Terms and Risk Disclosure Copyright © 2026. Algo Trading Systems LLC.