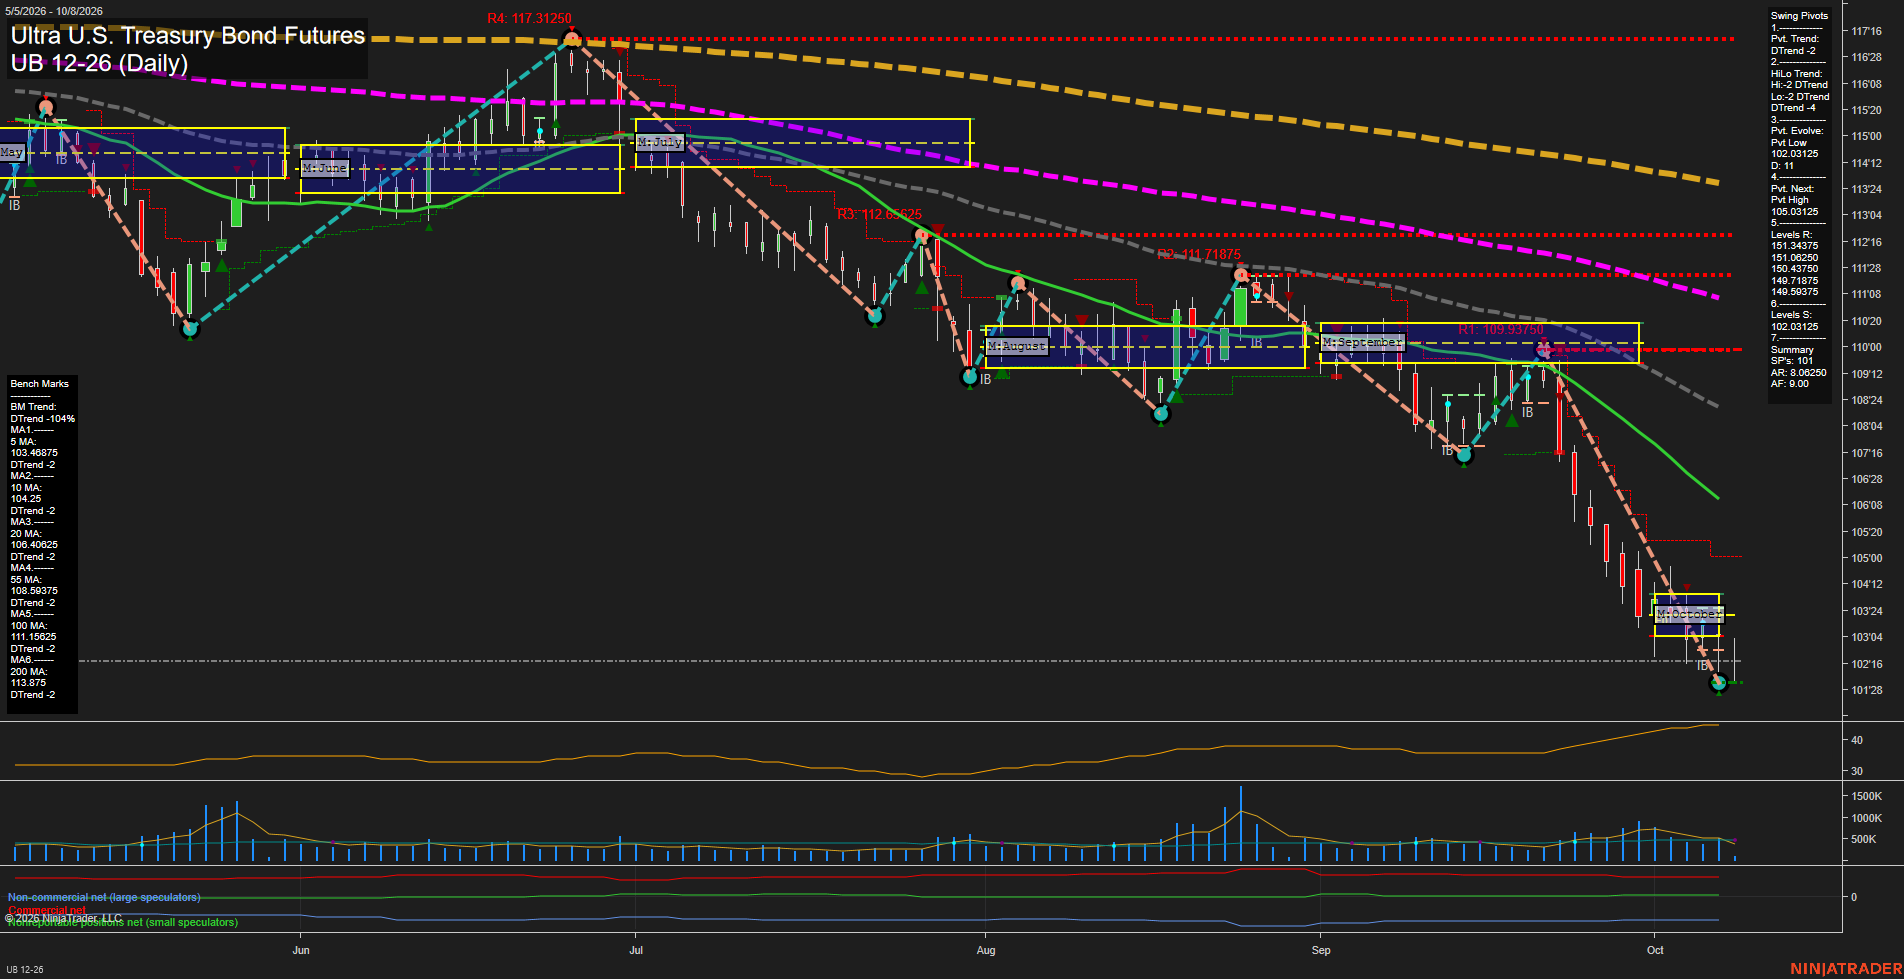
UB Ultra U.S. Treasury Bond Futures Daily Chart Analysis: 2026-Oct-08 07:11 CT
Price Action
- Last: 102.15625,
- Bars: Medium,
- Mom: fast.
WSFG Weekly
- Short-Term
- WSFG Current: -37%
- F0%/NTZ' Bias: Price Below,
- WSFG Trend: Down.
MSFG Month Oct
- Intermediate-Term
- MSFG Current: -23%
- F0%/NTZ' Bias: Price Below,
- MSFG Trend: Down.
YSFG Year 2026
- Long-Term
- YSFG Current: -42%
- F0%/NTZ' Bias: Price Below,
- YSFG Trend: Down.
Swing Pivots
- (Short-Term) 1. Pvt. Trend: DTrend,
- (Intermediate-Term) 2. HiLo Trend: DTrend,
- 3. Pvt. Evolve: Pvt low 102.03125,
- 4. Pvt. Next: Pvt high 105.03125,
- 5. Levels R: 151.34375, 151.06250, 150.43750, 149.71875, 149.59375,
- 6. Levels S: 102.03125.
Daily Benchmarks
- (Short-Term) 5 Day: 103.46875 Down Trend,
- (Short-Term) 10 Day: 104.25 Down Trend,
- (Intermediate-Term) 20 Day: 106.40625 Down Trend,
- (Intermediate-Term) 55 Day: 108.59375 Down Trend,
- (Long-Term) 100 Day: 111.5625 Down Trend,
- (Long-Term) 200 Day: 113.875 Down Trend.
Additional Metrics
Recent Trade Signals
- 07 Oct 2026: Short UB 12-26 @ 102.71875 Signals.USAR-MSFG
Overall Rating
- Short-Term: Bearish,
- Intermediate-Term: Bearish,
- Long-Term: Bearish.
Key Insights Summary
Price remains in a broad, persistent decline with lower highs and lower lows across the pivot structure. The accelerated September-to-October selloff has carried UB below all daily benchmarks and below the weekly, monthly, and yearly Fib-grid centers. The current 102.03125 pivot low is the immediate structural reference, while the 105.03125 reversal threshold defines the next opposite pivot condition. Rising ATR and recent volume expansion confirm an active, fast-momentum downswing rather than a low-volatility consolidation.
Chart Analysis ATS AI Generated: 2026-10-08 07:11 for Informational use only, not trading advice. Terms and Risk Disclosure Copyright © 2026. Algo Trading Systems LLC.