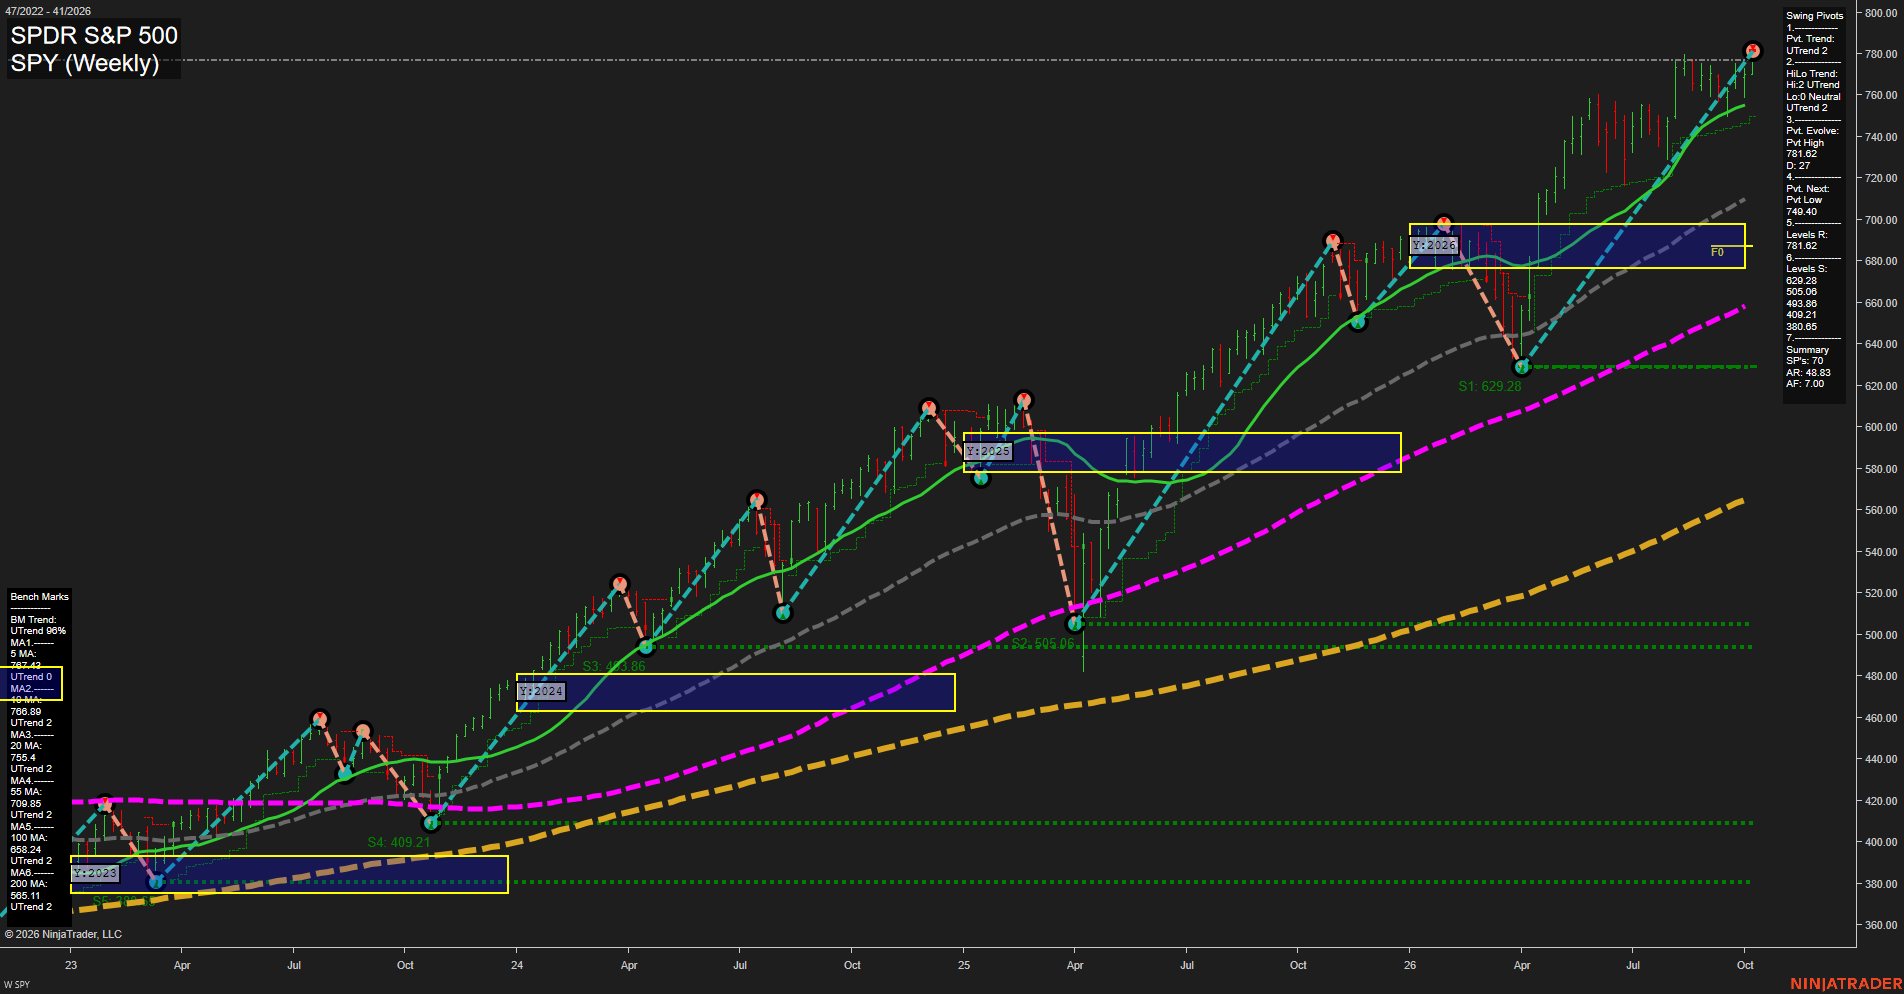
SPY SPDR S&P 500 Weekly Chart Analysis: 2026-Oct-08 07:11 CT
Price Action
- Last: 781.62,
- Bars: Medium,
- Mom: Fast.
WSFG Weekly
- Short-Term
- WSFG Current: NA%
- F0%/NTZ' Bias: Price Bullish,
- WSFG Trend: Bullish.
MSFG Month Oct
- Intermediate-Term
- MSFG Current: NA%
- F0%/NTZ' Bias: Price Bullish,
- MSFG Trend: Bullish.
YSFG Year 2026
- Long-Term
- YSFG Current: NA%
- F0%/NTZ' Bias: Price Above NTZ,
- YSFG Trend: Bullish.
Swing Pivots
- (Short-Term) 1. Pvt. Trend: UTrend,
- (Intermediate-Term) 2. HiLo Trend: UTrend,
- 3. Pvt. Evolve: Pvt high 781.62,
- 4. Pvt. Next: Pvt low 749.40,
- 5. Levels R: 781.62,
- 6. Levels S: 693.28, 650.06, 493.88, 409.21, 380.65, 370.00.
Weekly Benchmarks
- (Short-Term) 5 Day: 784.47 Up Trend,
- (Short-Term) 10 Day: 768.89 Up Trend,
- (Intermediate-Term) 20 Day: 755.45 Up Trend,
- (Intermediate-Term) 55 Day: 709.85 Up Trend,
- (Long-Term) 100 Day: 658.24 Up Trend,
- (Long-Term) 200 Day: 585.11 Up Trend.
Overall Rating
- Short-Term: Bullish,
- Intermediate-Term: Bullish,
- Long-Term: Bullish.
Key Insights Summary
SPY’s weekly structure remains broadly aligned with an equity-index futures swing uptrend: price is near 781.62, pivot trend and HiLo trend are both UTrend, and all six benchmark averages are rising beneath price. The advance is fast and has extended materially above the 20-, 55-, 100-, and 200-week benchmarks, reflecting persistent upside momentum. The 781.62 pivot-high area is the immediate overhead reference, while 749.40 defines the current opposite-pivot reversal level. Beneath that, 693.28 and 650.06 are the principal structural support references. Price is well above the 2026 yearly NTZ, indicating a strong long-term expansion phase, although the recent steep trajectory and mixed weekly candle bodies characterize a high-momentum, potentially volatile continuation environment rather than a low-volatility consolidation.
Chart Analysis ATS AI Generated: 2026-10-08 07:11 for Informational use only, not trading advice. Terms and Risk Disclosure Copyright © 2026. Algo Trading Systems LLC.