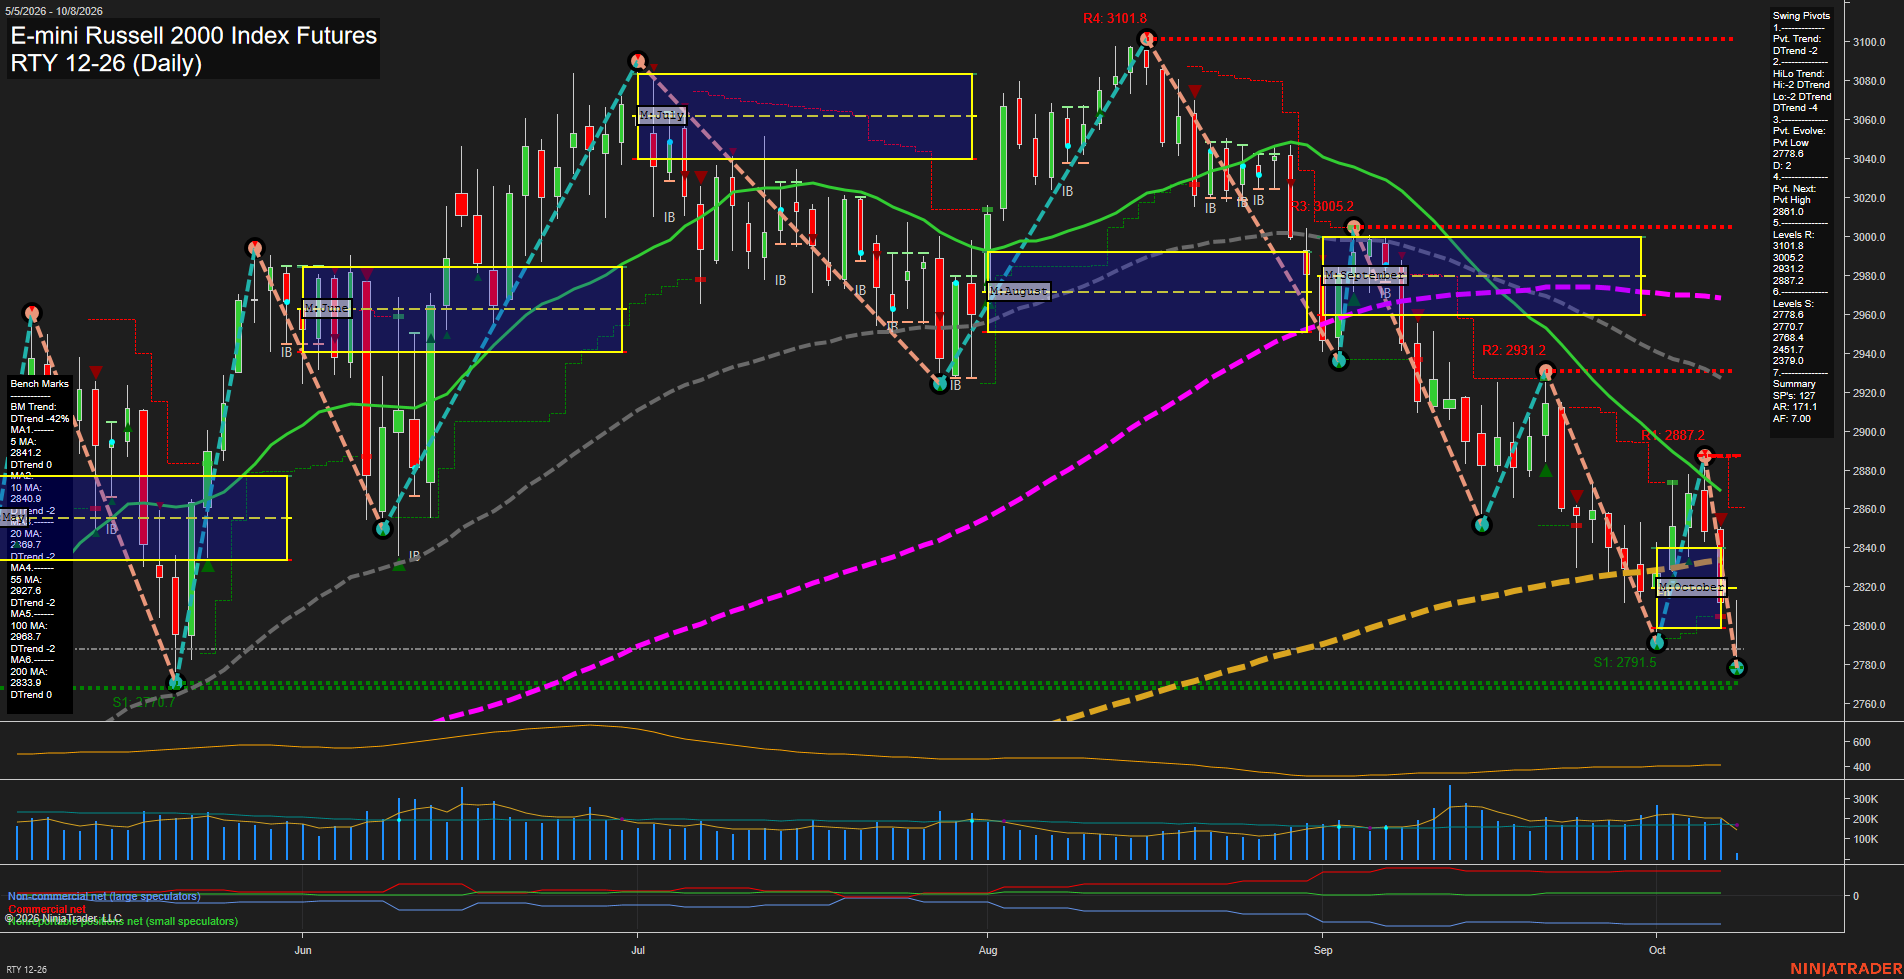
RTY E-mini Russell 2000 Index Futures Daily Chart Analysis: 2026-Oct-08 07:09 CT
Price Action
- Last: 2778.0,
- Bars: Large,
- Mom: fast.
WSFG Weekly
- Short-Term
- WSFG Current: -69%
- F0%/NTZ' Bias: Price Below,
- WSFG Trend: Down.
MSFG Month Oct
- Intermediate-Term
- MSFG Current: -22%
- F0%/NTZ' Bias: Price Below,
- MSFG Trend: Down.
YSFG Year 2026
- Long-Term
- YSFG Current: 31%
- F0%/NTZ' Bias: Price Above,
- YSFG Trend: Up.
Swing Pivots
- (Short-Term) 1. Pvt. Trend: DTrend,
- (Intermediate-Term) 2. HiLo Trend: DTrend,
- 3. Pvt. Evolve: Pvt low 2778.0,
- 4. Pvt. Next: Pvt high 2881.0,
- 5. Levels R: 3101.8, 3005.2, 2931.2, 2887.2,
- 6. Levels S: 2778.6, 2770.7, 2768.4, 2451.7, 2379.0.
Daily Benchmarks
- (Short-Term) 5 Day: 2841.2 Down Trend,
- (Short-Term) 10 Day: 2840.9 Down Trend,
- (Intermediate-Term) 20 Day: 2893.7 Down Trend,
- (Intermediate-Term) 55 Day: 2927.6 Down Trend,
- (Long-Term) 100 Day: 2968.7 Down Trend,
- (Long-Term) 200 Day: 2833.9 Down Trend.
Additional Metrics
Recent Trade Signals
- 08 Oct 2026: Short RTY 12-26 @ 2801.1 Signals.USAR-MSFG
- 07 Oct 2026: Short RTY 12-26 @ 2841.2 Signals.USAR-WSFG
- 02 Oct 2026: Long RTY 12-26 @ 2843.4 Signals.USAR.TR120
Overall Rating
- Short-Term: Bearish,
- Intermediate-Term: Bearish,
- Long-Term: Bearish.
Key Insights Summary
RTY has transitioned into a sharp downside swing, with large-range selling pressure driving price beneath the weekly and monthly F0% zones and below every displayed benchmark average. The pivot structure is decisively bearish, showing both short-term and intermediate-term DTrends, lower highs, and a newly evolving pivot low at 2778.0. The 2770.7-2768.4 support cluster is being tested following the October selloff, while 2833.9-2841.2 marks the first overhead moving-average and prior-price resistance area. Volatility remains elevated relative to recent consolidation, and the current decline reflects downside continuation rather than a completed reversal pattern. The annual grid remains positive, but daily long-term benchmarks have deteriorated, creating a conflict between the broader yearly backdrop and the current multi-timeframe bearish price cycle.
Chart Analysis ATS AI Generated: 2026-10-08 07:09 for Informational use only, not trading advice. Terms and Risk Disclosure Copyright © 2026. Algo Trading Systems LLC.