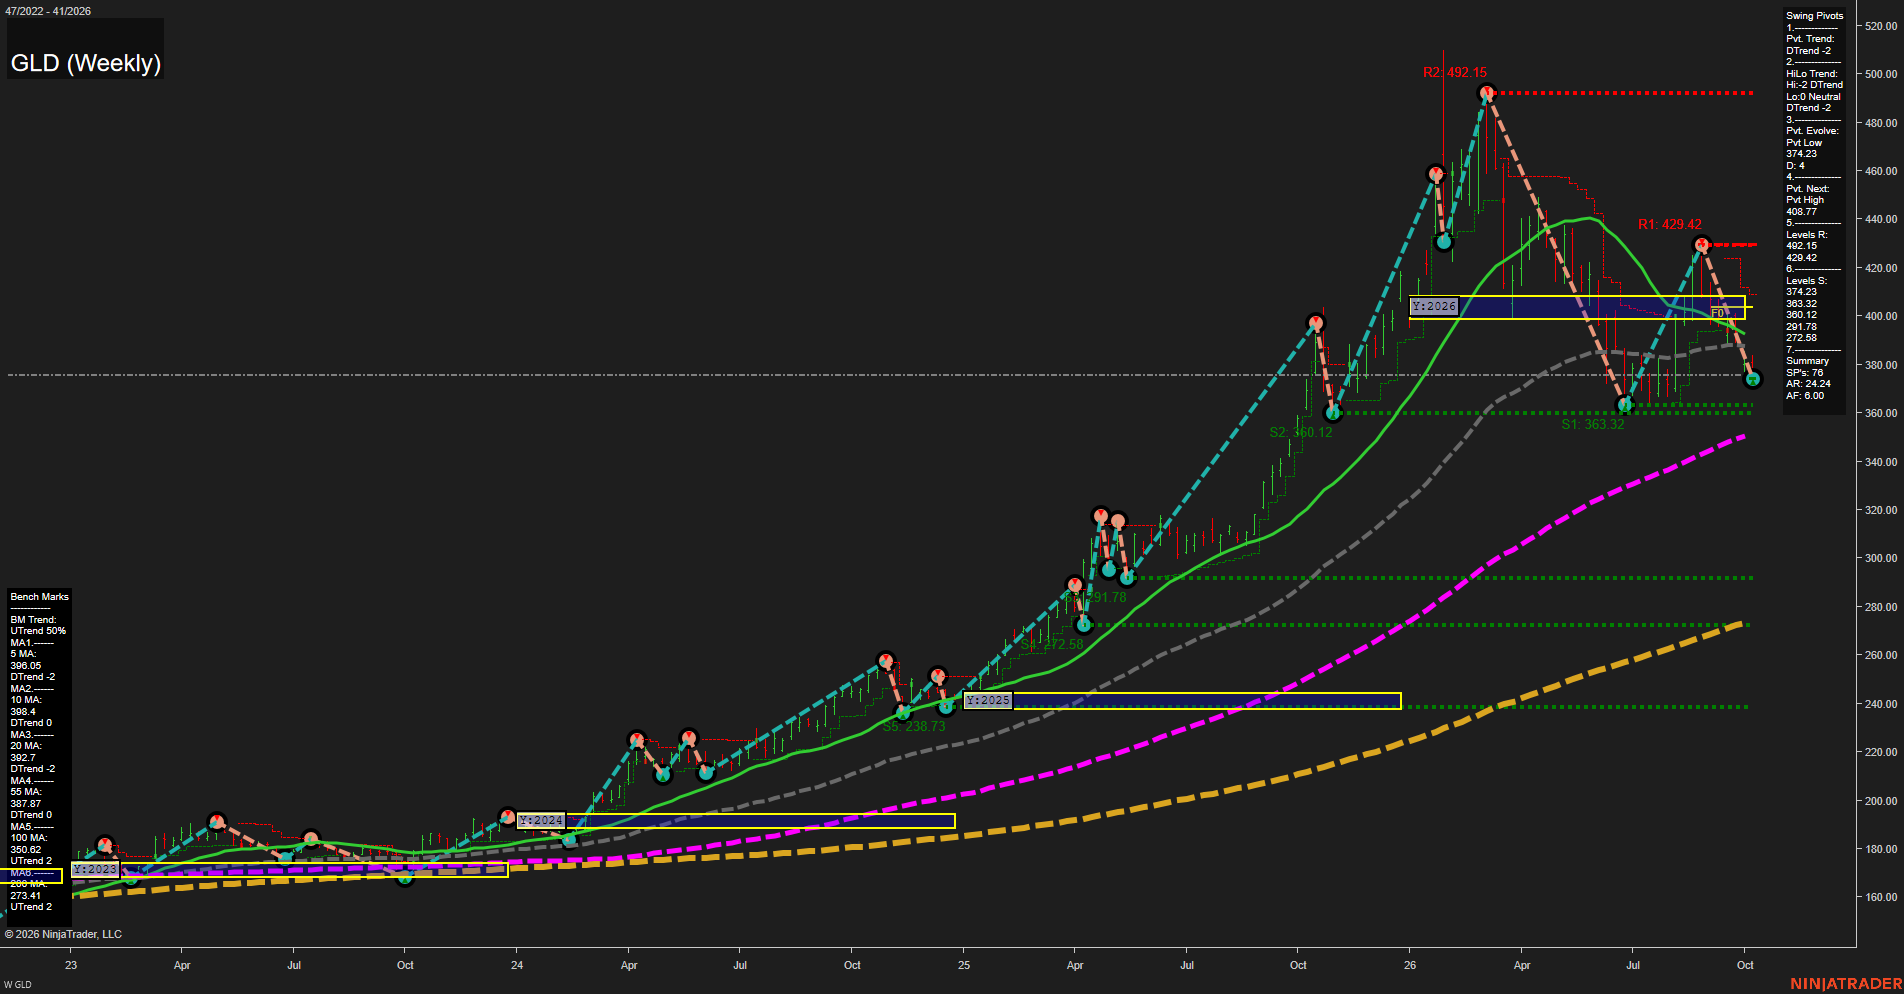
GLD SPDR Gold Shares Weekly Chart Analysis: 2026-Oct-08 07:06 CT
Price Action
- Last: 374.23,
- Bars: Medium,
- Mom: Fast.
WSFG Weekly
- Short-Term
- WSFG Current: NA%
- F0%/NTZ' Bias: Price Below F0%/NTZ,
- WSFG Trend: Downtrend.
MSFG Month Oct
- Intermediate-Term
- MSFG Current: NA%
- F0%/NTZ' Bias: Price Below F0%/NTZ,
- MSFG Trend: Downtrend.
YSFG Year 2026
- Long-Term
- YSFG Current: NA%
- F0%/NTZ' Bias: Price Below F0%/NTZ,
- YSFG Trend: Downtrend.
Swing Pivots
- (Short-Term) 1. Pvt. Trend: DTrend,
- (Intermediate-Term) 2. HiLo Trend: DTrend,
- 3. Pvt. Evolve: Pvt low 374.23,
- 4. Pvt. Next: Pvt high 408.77,
- 5. Levels R: 492.15, 429.42,
- 6. Levels S: 374.23, 363.32, 360.12, 291.78, 272.58.
Weekly Benchmarks
- (Short-Term) 5 Day: 396.05 Down Trend,
- (Short-Term) 10 Day: 398.40 Down Trend,
- (Intermediate-Term) 20 Day: 392.70 Down Trend,
- (Intermediate-Term) 55 Day: 387.87 Down Trend,
- (Long-Term) 100 Day: 350.62 Up Trend,
- (Long-Term) 200 Day: 273.41 Up Trend.
Overall Rating
- Short-Term: Bearish,
- Intermediate-Term: Bearish,
- Long-Term: Bullish.
Key Insights Summary
GLD reflects a futures-style weekly corrective phase: fast downside momentum has pushed price beneath the 5, 10, 20, and 55-week benchmarks while both pivot structures are in DTrend. The decline from the 429.42 pivot high has produced lower-high and lower-low behavior, with 374.23 the active pivot-low level and 363.32-360.12 the next clustered support zone. A recovery through 408.77 would define the next opposing pivot event, while 429.42 remains the principal intermediate resistance. Despite the cyclical pullback and bearish annual-grid position below the 400-area F0% region, the longer-term structure remains constructive because price holds above rising 100- and 200-week benchmarks.
Chart Analysis ATS AI Generated: 2026-10-08 07:07 for Informational use only, not trading advice. Terms and Risk Disclosure Copyright © 2026. Algo Trading Systems LLC.