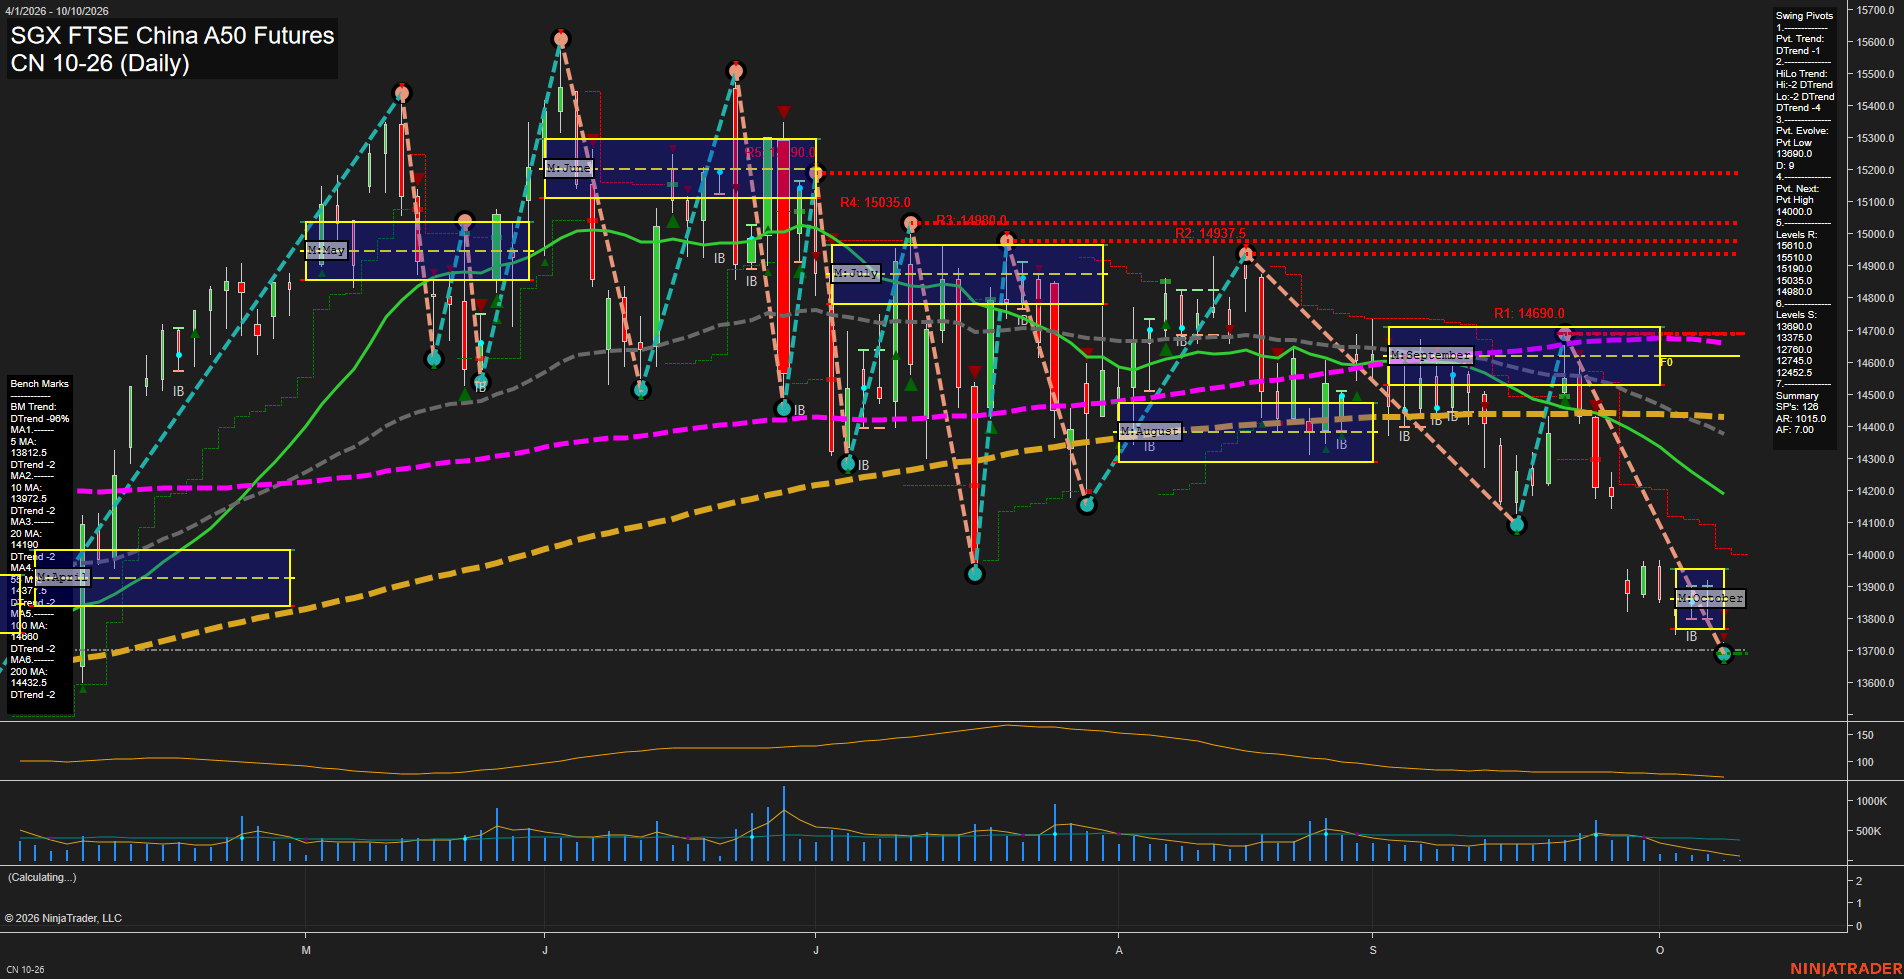
CN SGX FTSE China A50 Futures Daily Chart Analysis: 2026-Oct-08 07:02 CT
Price Action
- Last: 13690.0,
- Bars: Medium,
- Mom: fast.
WSFG Weekly
- Short-Term
- WSFG Current: NA%
- F0%/NTZ' Bias: Price Below NTZ,
- WSFG Trend: Bearish.
MSFG Month Oct
- Intermediate-Term
- MSFG Current: NA%
- F0%/NTZ' Bias: Price Below NTZ,
- MSFG Trend: Bearish.
YSFG Year 2026
- Long-Term
- YSFG Current: NA%
- F0%/NTZ' Bias: Price Neutral,
- YSFG Trend: Neutral.
Swing Pivots
- (Short-Term) 1. Pvt. Trend: DTrend,
- (Intermediate-Term) 2. HiLo Trend: DTrend,
- 3. Pvt. Evolve: Pvt low 13690.0,
- 4. Pvt. Next: Pvt high 14000.0,
- 5. Levels R: 15810.0, 15510.0, 15190.0, 15035.0, 14980.0,
- 6. Levels S: 13690.0, 13375.0, 12700.0, 12455.0.
Daily Benchmarks
- (Short-Term) 5 Day: 13812.5 Down Trend,
- (Short-Term) 10 Day: 13972.5 Down Trend,
- (Intermediate-Term) 20 Day: 14190.0 Down Trend,
- (Intermediate-Term) 55 Day: 14371.5 Down Trend,
- (Long-Term) 100 Day: 14680.0 Down Trend,
- (Long-Term) 200 Day: 14443.5 Down Trend.
Additional Metrics
- ATR: 105.0,
- VOLMA: 261842.
Overall Rating
- Short-Term: Bearish,
- Intermediate-Term: Bearish,
- Long-Term: Bearish.
Key Insights Summary
Price is extending a fast downside swing and has established a fresh 13690.0 pivot low, while both the short-term pivot trend and intermediate HiLo structure remain in DTrend. The October grid is below its NTZ/F0% region and price is beneath every benchmark from the 5-day through 200-day average, confirming broad bearish alignment. The 14000.0 next-pivot threshold marks the first structural recovery level, while 13375.0 is the next lower support beneath the current low. ATR at 105.0 reflects elevated daily swing range as the decline tests the October low area; volume has moderated following the recent selloff, indicating a lower-participation extension rather than a high-volume reversal.
Chart Analysis ATS AI Generated: 2026-10-08 07:03 for Informational use only, not trading advice. Terms and Risk Disclosure Copyright © 2026. Algo Trading Systems LLC.