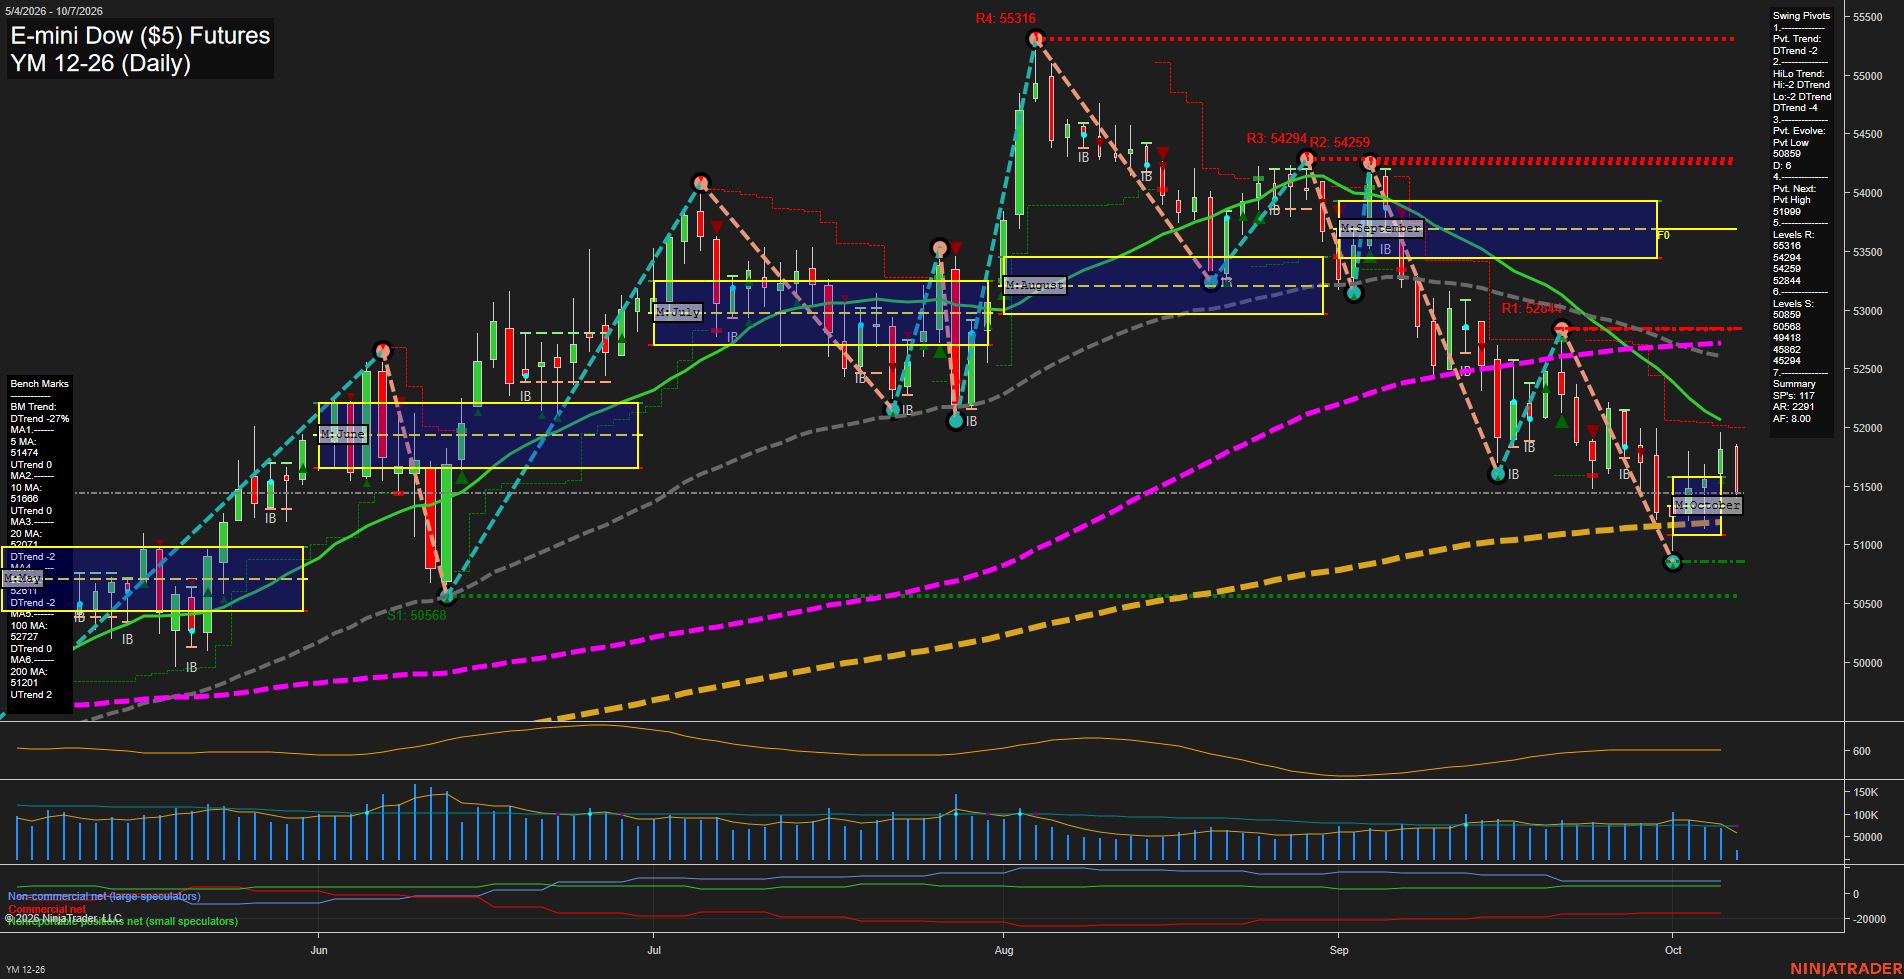
YM E-mini Dow ($5) Futures Daily Chart Analysis: 2026-Oct-07 07:12 CT
Price Action
- Last: 51645,
- Bars: Medium,
- Mom: average.
WSFG Weekly
- Short-Term
- WSFG Current: -1%
- F0%/NTZ' Bias: Price Below,
- WSFG Trend: Down.
MSFG Month Oct
- Intermediate-Term
- MSFG Current: 4%
- F0%/NTZ' Bias: Price Above,
- MSFG Trend: Up.
YSFG Year 2026
- Long-Term
- YSFG Current: 19%
- F0%/NTZ' Bias: Price Above,
- YSFG Trend: Up.
Swing Pivots
- (Short-Term) 1. Pvt. Trend: DTrend,
- (Intermediate-Term) 2. HiLo Trend: DTrend,
- 3. Pvt. Evolve: Pvt low 50859,
- 4. Pvt. Next: Pvt high 51999,
- 5. Levels R: 55316, 54294, 54259, 52849,
- 6. Levels S: 50859, 50568, 49418, 45829.
Daily Benchmarks
- (Short-Term) 5 Day: 51474 Up Trend,
- (Short-Term) 10 Day: 51686 Up Trend,
- (Intermediate-Term) 20 Day: 52036 Down Trend,
- (Intermediate-Term) 55 Day: 52801 Down Trend,
- (Long-Term) 100 Day: 52720 Down Trend,
- (Long-Term) 200 Day: 51201 Up Trend.
Additional Metrics
Recent Trade Signals
- 06 Oct 2026: Long YM 12-26 @ 51645 Signals.USAR-WSFG
- 06 Oct 2026: Long YM 12-26 @ 51645 Signals.USAR-MSFG
- 29 Sep 2026: Short YM 12-26 @ 51498 Signals.USAR.TR120
Overall Rating
- Short-Term: Bearish,
- Intermediate-Term: Bearish,
- Long-Term: Bullish.
Key Insights Summary
Price is rebounding from the 50859 swing low and has recovered above the rising 5-day average and 200-day benchmark, but the active short-term and intermediate-term pivot structures remain in DTrend. The recovery is occurring beneath the 10-day, 20-day, 55-day, and 100-day benchmarks, defining 51999 and the 52036 to 52801 benchmark zone as the primary overhead technical barrier. The October MSFG and 2026 yearly grid retain positive positioning, while the weekly grid remains negative, reflecting a countertrend bounce within a broader daily pullback. Volatility remains elevated with a 512 ATR, consistent with wide daily rotations and choppy swing conditions.
Chart Analysis ATS AI Generated: 2026-10-07 07:12 for Informational use only, not trading advice. Terms and Risk Disclosure Copyright © 2026. Algo Trading Systems LLC.