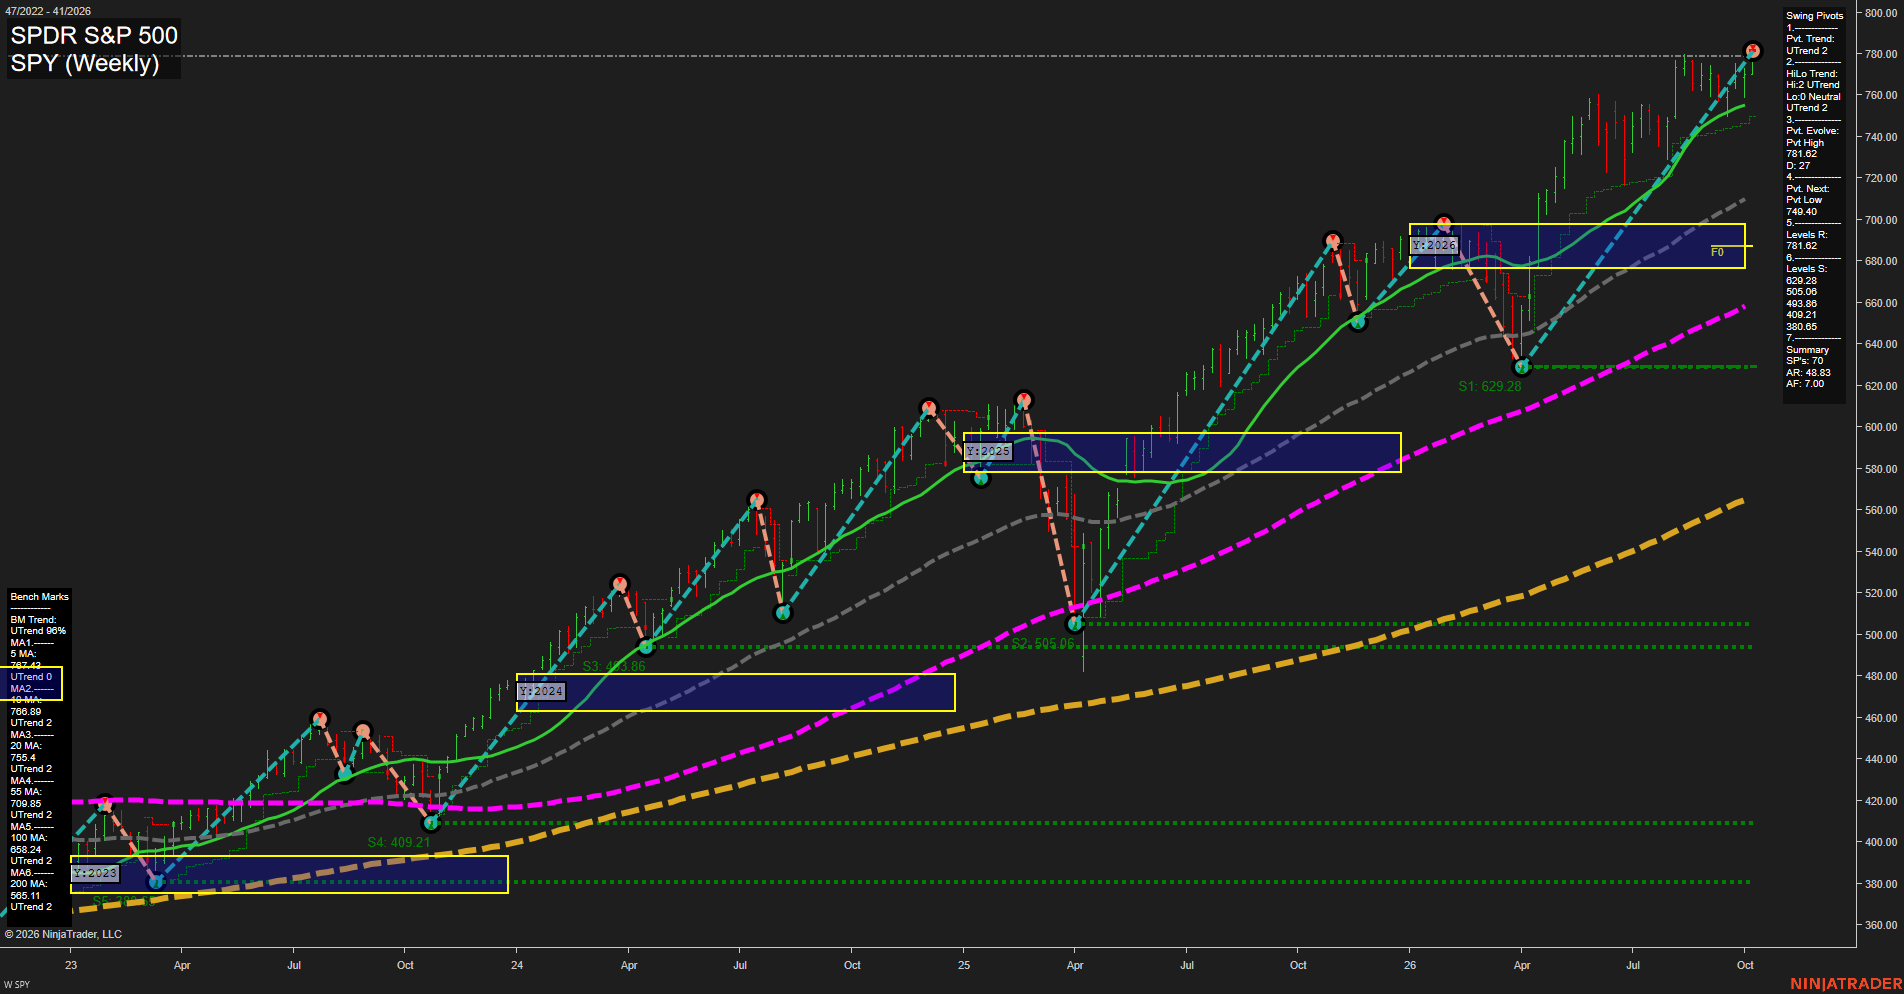
SPY SPDR S&P 500 Weekly Chart Analysis: 2026-Oct-07 07:10 CT
Price Action
- Last: 781.62,
- Bars: Small,
- Mom: fast.
WSFG Weekly
- Short-Term
- WSFG Current: NA%
- F0%/NTZ' Bias: Price Above NTZ,
- WSFG Trend: UTrend.
MSFG Month Oct
- Intermediate-Term
- MSFG Current: NA%
- F0%/NTZ' Bias: Price Above NTZ,
- MSFG Trend: UTrend.
YSFG Year 2026
- Long-Term
- YSFG Current: NA%
- F0%/NTZ' Bias: Price Above NTZ,
- YSFG Trend: UTrend.
Swing Pivots
- (Short-Term) 1. Pvt. Trend: UTrend,
- (Intermediate-Term) 2. HiLo Trend: UTrend,
- 3. Pvt. Evolve: Pvt high 781.62,
- 4. Pvt. Next: Pvt low 749.40,
- 5. Levels R: 781.62,
- 6. Levels S: 692.28, 650.08, 493.38, 409.21, 380.65, 370.09.
Weekly Benchmarks
- (Short-Term) 5 Day: 787.47 UTrend,
- (Short-Term) 10 Day: 766.89 UTrend,
- (Intermediate-Term) 20 Day: 755.45 UTrend,
- (Intermediate-Term) 55 Day: 709.85 UTrend,
- (Long-Term) 100 Day: 658.24 UTrend,
- (Long-Term) 200 Day: 565.11 UTrend.
Overall Rating
- Short-Term: Bullish,
- Intermediate-Term: Bullish,
- Long-Term: Bullish.
Key Insights Summary
The futures-swing backdrop is broadly bullish, with SPY holding near a fresh pivot high at 781.62 and trading above every weekly benchmark. The short-term structure remains a higher-high and higher-low sequence, while the 749.40 pivot-next level defines the nearest structural reversal reference. Price is materially extended above the 20-, 55-, 100-, and 200-period averages and above the 2026 yearly NTZ, reflecting strong directional momentum rather than balanced consolidation. The 781.62 high is the immediate upside reference, while 749.40, 709.85, and the 692.28 yearly support area frame progressively deeper retracement zones for the broader ES-equivalent swing structure.
Chart Analysis ATS AI Generated: 2026-10-07 07:11 for Informational use only, not trading advice. Terms and Risk Disclosure Copyright © 2026. Algo Trading Systems LLC.