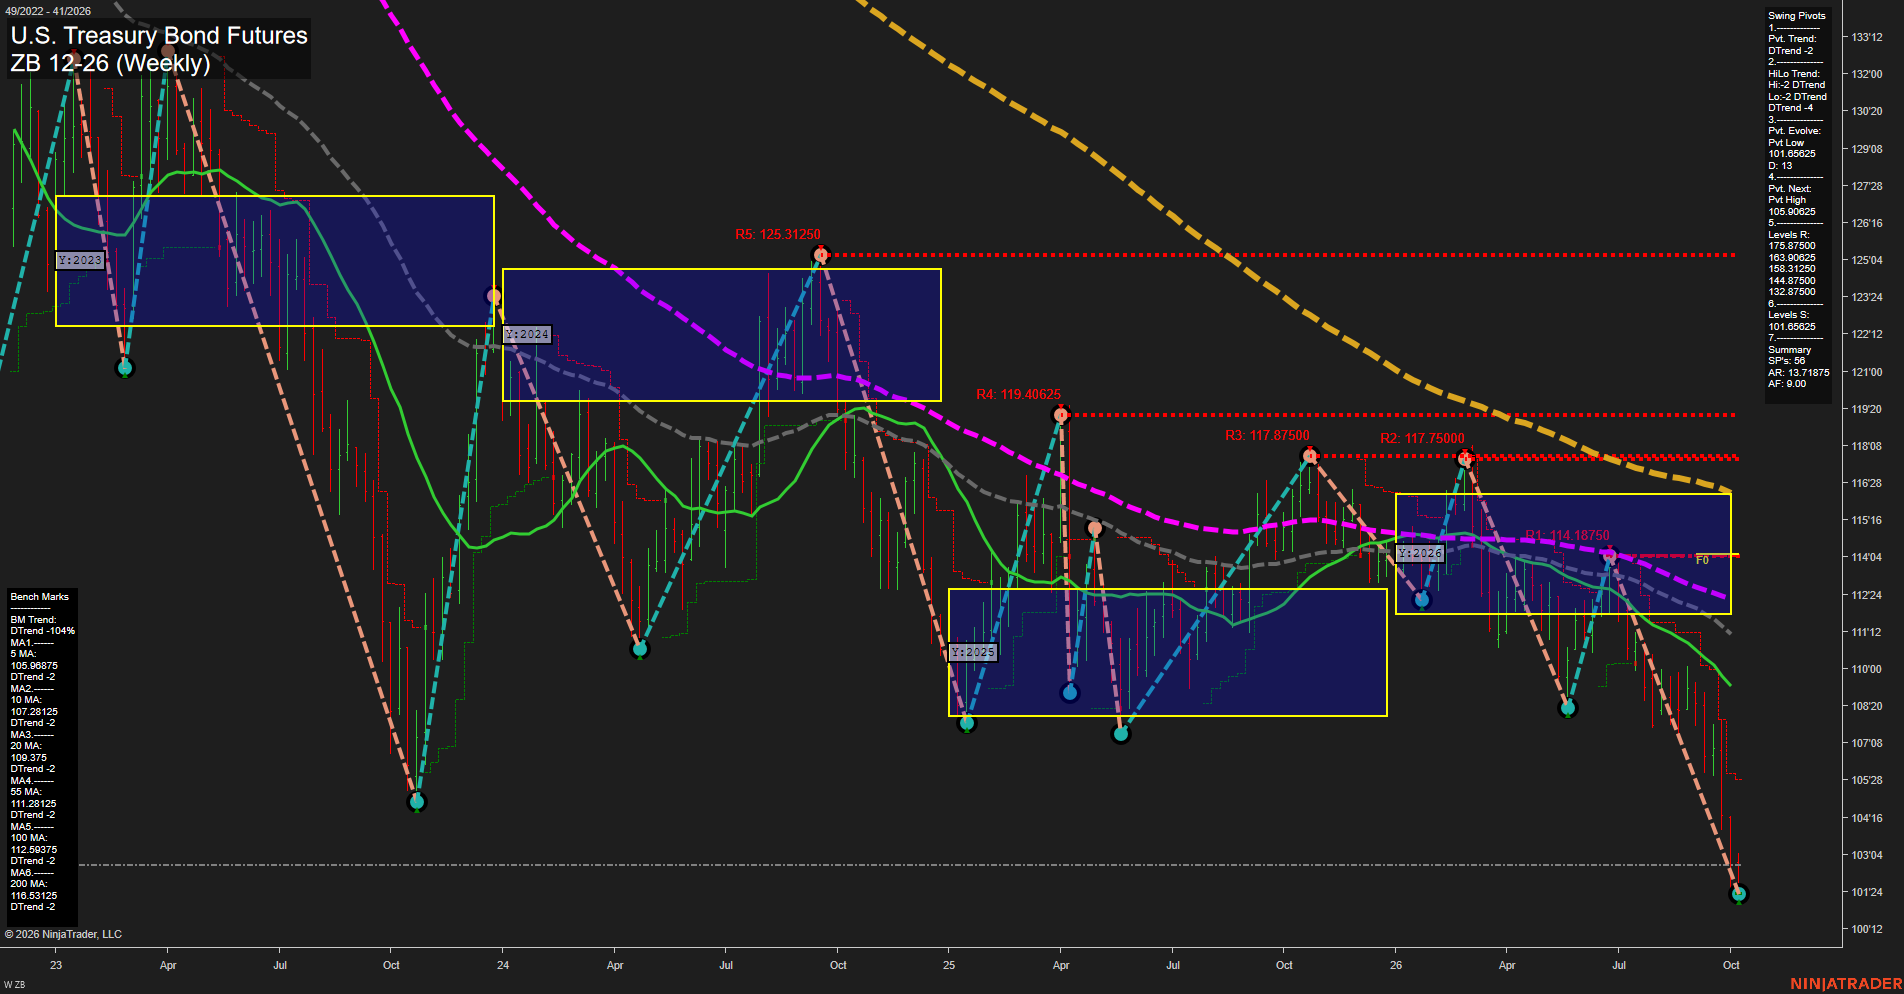
ZB U.S. Treasury Bond Futures Weekly Chart Analysis: 2026-Oct-06 07:12 CT
Price Action
- Last: 101.6875,
- Bars: Large,
- Mom: Momentum fast.
WSFG Weekly
- Short-Term
- WSFG Current: -2%
- F0%/NTZ' Bias: Price Below,
- WSFG Trend: Down.
MSFG Month Oct
- Intermediate-Term
- MSFG Current: -3%
- F0%/NTZ' Bias: Price Below,
- MSFG Trend: Down.
YSFG Year 2026
- Long-Term
- YSFG Current: -51%
- F0%/NTZ' Bias: Price Below,
- YSFG Trend: Down.
Swing Pivots
- (Short-Term) 1. Pvt. Trend: DTrend,
- (Intermediate-Term) 2. HiLo Trend: DTrend,
- 3. Pvt. Evolve: Pvt low 101.6875,
- 4. Pvt. Next: Pvt high 105.90625,
- 5. Levels R: 175.87500, 163.90625, 158.31250, 144.87500, 132.87500,
- 6. Levels S: 101.65625.
Weekly Benchmarks
- (Short-Term) 5 Day: 105.96875 Down Trend,
- (Short-Term) 10 Day: 107.28125 Down Trend,
- (Intermediate-Term) 20 Day: 109.37500 Down Trend,
- (Intermediate-Term) 55 Day: 111.28125 Down Trend,
- (Long-Term) 100 Day: 112.59375 Down Trend,
- (Long-Term) 200 Day: 116.53125 Down Trend.
Overall Rating
- Short-Term: Bearish,
- Intermediate-Term: Bearish,
- Long-Term: Bearish.
Key Insights Summary
ZB remains in a broad, accelerated weekly decline, with price extending beneath the weekly, monthly, and yearly Fib-grid balance areas. The current swing structure is a DTrend with a fresh pivot low near 101.6875, while the next opposite pivot threshold is 105.90625. Large weekly bars and fast downside momentum reflect persistent liquidation rather than a mature consolidation. Price is below every benchmark average, and the averages are bearishly aligned from the 5-period through the 200-period measure. The weekly chart retains a lower-high/lower-low sequence, with the 105.90625 pivot threshold defining the nearest countertrend recovery reference and the 101.65625 support area marking the immediate low-zone test.
Chart Analysis ATS AI Generated: 2026-10-06 07:13 for Informational use only, not trading advice. Terms and Risk Disclosure Copyright © 2026. Algo Trading Systems LLC.