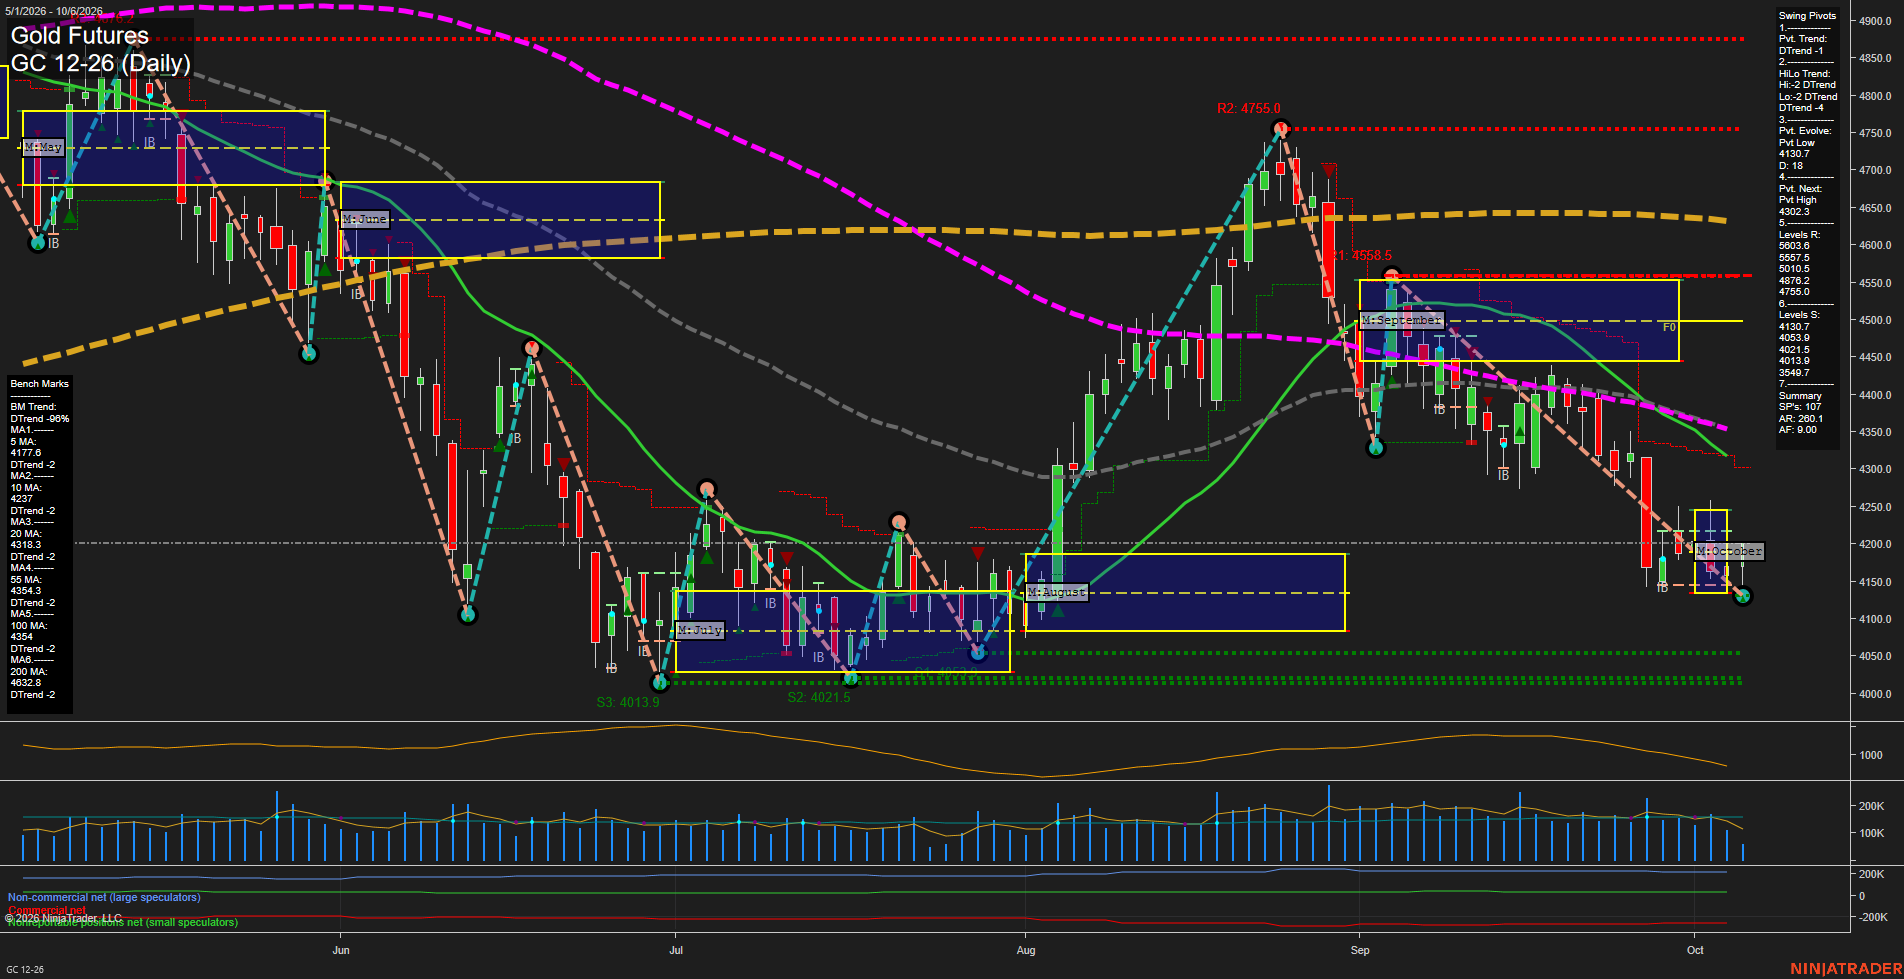
GC Gold Futures Daily Chart Analysis: 2026-Oct-06 07:05 CT
Price Action
- Last: 4146.6,
- Bars: Medium,
- Mom: average.
WSFG Weekly
- Short-Term
- WSFG Current: 20%
- F0%/NTZ' Bias: Price Above,
- WSFG Trend: Up.
MSFG Month Oct
- Intermediate-Term
- MSFG Current: -1%
- F0%/NTZ' Bias: Price Below,
- MSFG Trend: Down.
YSFG Year 2026
- Long-Term
- YSFG Current: -103%
- F0%/NTZ' Bias: Price Below,
- YSFG Trend: Down.
Swing Pivots
- (Short-Term) 1. Pvt. Trend: DTrend,
- (Intermediate-Term) 2. HiLo Trend: DTrend,
- 3. Pvt. Evolve: Pvt low 4130.7,
- 4. Pvt. Next: Pvt high 4303.7,
- 5. Levels R: 5603.6, 5507.5, 5010.5, 4876.2, 4755.0,
- 6. Levels S: 4130.7, 4053.9, 4021.5, 4013.9, 3549.7.
Daily Benchmarks
- (Short-Term) 5 Day: 4177.6 Down Trend,
- (Short-Term) 10 Day: 4237.0 Down Trend,
- (Intermediate-Term) 20 Day: 4318.9 Down Trend,
- (Intermediate-Term) 55 Day: 4354.3 Down Trend,
- (Long-Term) 100 Day: 4354.6 Down Trend,
- (Long-Term) 200 Day: 4632.8 Down Trend.
Additional Metrics
Recent Trade Signals
- 06 Oct 2026: Long GC 12-26 @ 4201.7 Signals.USAR-WSFG
- 06 Oct 2026: Short GC 12-26 @ 4146.6 Signals.USAR-MSFG
Overall Rating
- Short-Term: Bearish,
- Intermediate-Term: Bearish,
- Long-Term: Bearish.
Key Insights Summary
Price is consolidating near the 4130.7 swing-low pivot after a sharp September-to-October decline. The weekly grid remains positive, indicating a short-term countertrend bounce structure, but the monthly grid, both pivot trends, and all six declining benchmark averages maintain a broader bearish alignment. The 4303.7 pivot-next level and clustered moving-average zone from 4318.9 to 4354.6 define the nearby overhead technical ceiling, while 4130.7 is the immediate downside pivot reference. Elevated daily range conditions and moderate volume reflect an active, volatile retracement phase within the prevailing intermediate- and long-term downtrend.
Chart Analysis ATS AI Generated: 2026-10-06 07:05 for Informational use only, not trading advice. Terms and Risk Disclosure Copyright © 2026. Algo Trading Systems LLC.