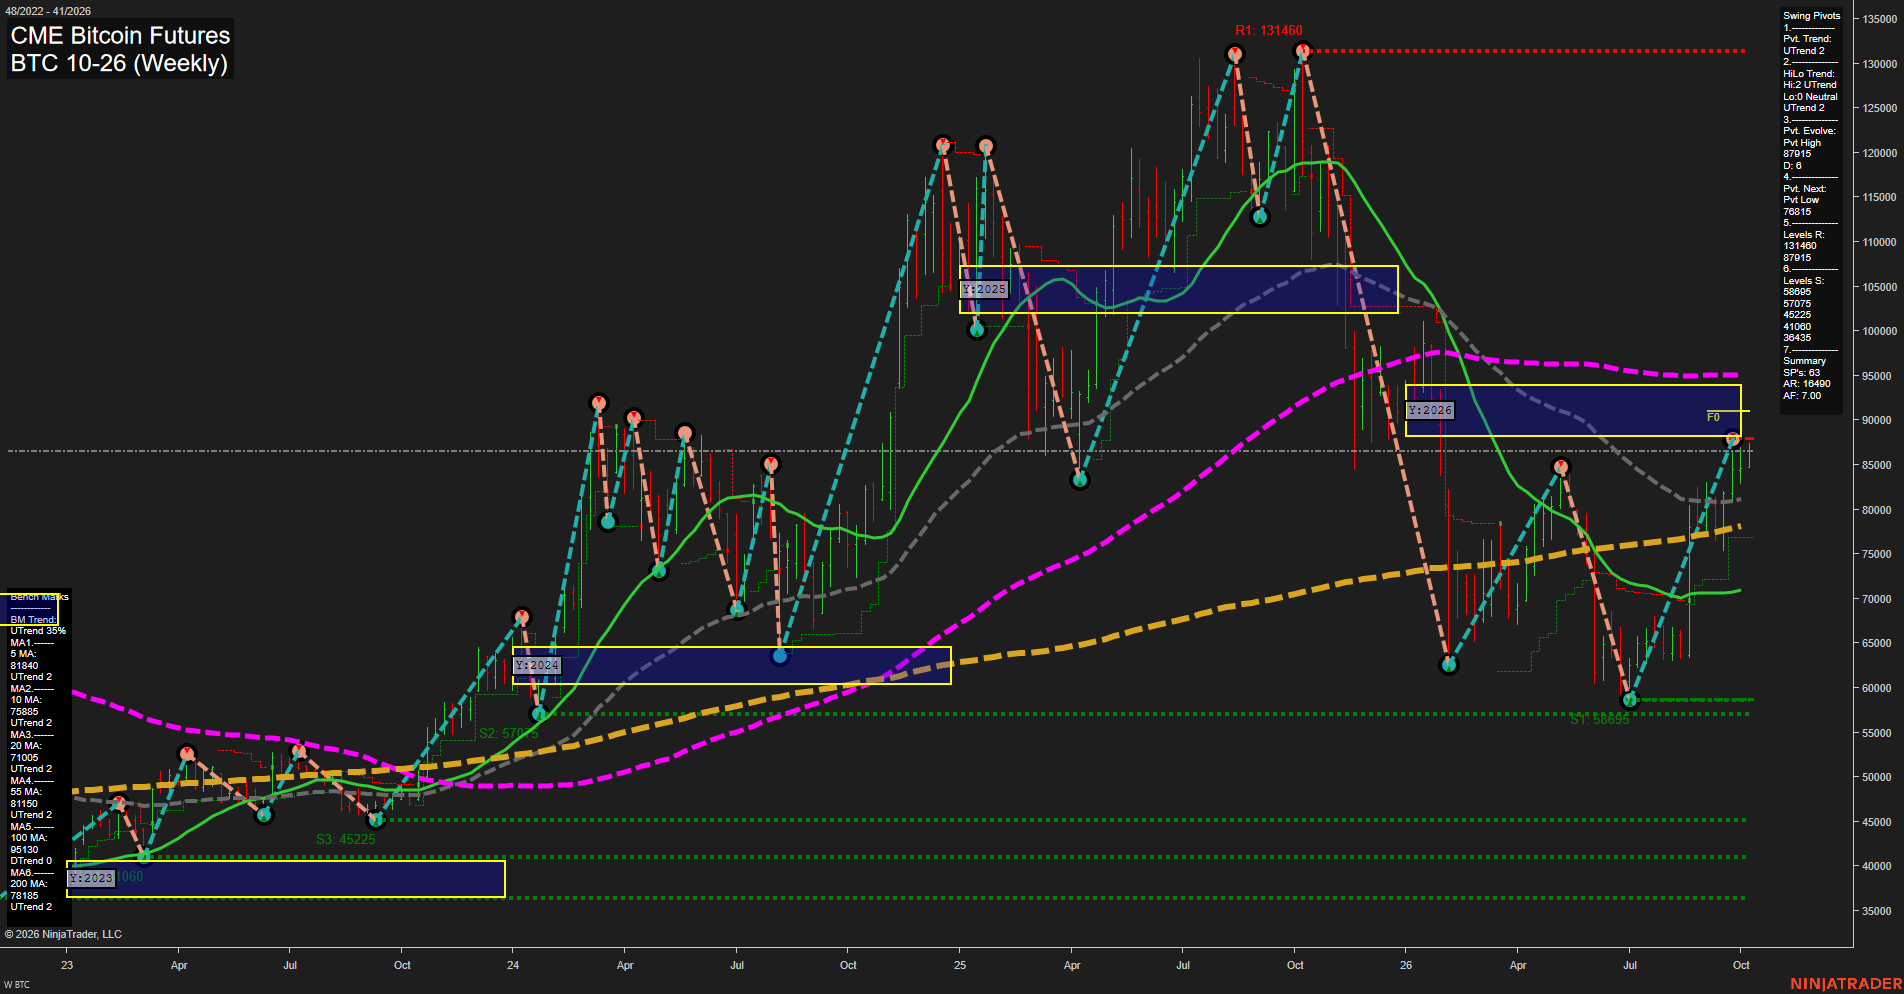
BTC CME Bitcoin Futures Weekly Chart Analysis: 2026-Oct-06 07:02 CT
Price Action
- Last: 85820,
- Bars: Medium,
- Mom: average.
WSFG Weekly
- Short-Term
- WSFG Current: 27%
- F0%/NTZ' Bias: Price Above,
- WSFG Trend: Up.
MSFG Month Oct
- Intermediate-Term
- MSFG Current: 16%
- F0%/NTZ' Bias: Price Above,
- MSFG Trend: Up.
YSFG Year 2026
- Long-Term
- YSFG Current: -16%
- F0%/NTZ' Bias: Price Below,
- YSFG Trend: Down.
Swing Pivots
- (Short-Term) 1. Pvt. Trend: UTrend,
- (Intermediate-Term) 2. HiLo Trend: UTrend,
- 3. Pvt. Evolve: Pvt high 87915,
- 4. Pvt. Next: Pvt low 78315,
- 5. Levels R: 131460, 87915,
- 6. Levels S: 58695, 57075, 45225, 41060, 36435.
Weekly Benchmarks
- (Short-Term) 5 Day: 81845 Up Trend,
- (Short-Term) 10 Day: 75885 Up Trend,
- (Intermediate-Term) 20 Day: 71005 Up Trend,
- (Intermediate-Term) 55 Day: 81150 Up Trend,
- (Long-Term) 100 Day: 95130 Down Trend,
- (Long-Term) 200 Day: 78180 Up Trend.
Recent Trade Signals
- 06 Oct 2026: Long BTC 10-26 @ 85820 Signals.USAR-MSFG
- 05 Oct 2026: Long BTC 10-26 @ 86845 Signals.USAR.TR120
- 04 Oct 2026: Long BTC 10-26 @ 86040 Signals.USAR-WSFG
Overall Rating
- Short-Term: Bullish,
- Intermediate-Term: Bullish,
- Long-Term: Neutral.
Key Insights Summary
Weekly structure reflects a rebound from the July low, with higher swing lows and price above the 5, 10, 20, 55, and 200 Day benchmarks. Short and intermediate grid trends are positive, although the 87915 pivot-high resistance remains the immediate overhead inflection level. The longer-term picture is mixed: price remains below the declining 100 Day benchmark and below the yearly F0% area, leaving the yearly grid trend down despite the developing recovery sequence.
Chart Analysis ATS AI Generated: 2026-10-06 07:02 for Informational use only, not trading advice. Terms and Risk Disclosure Copyright © 2026. Algo Trading Systems LLC.