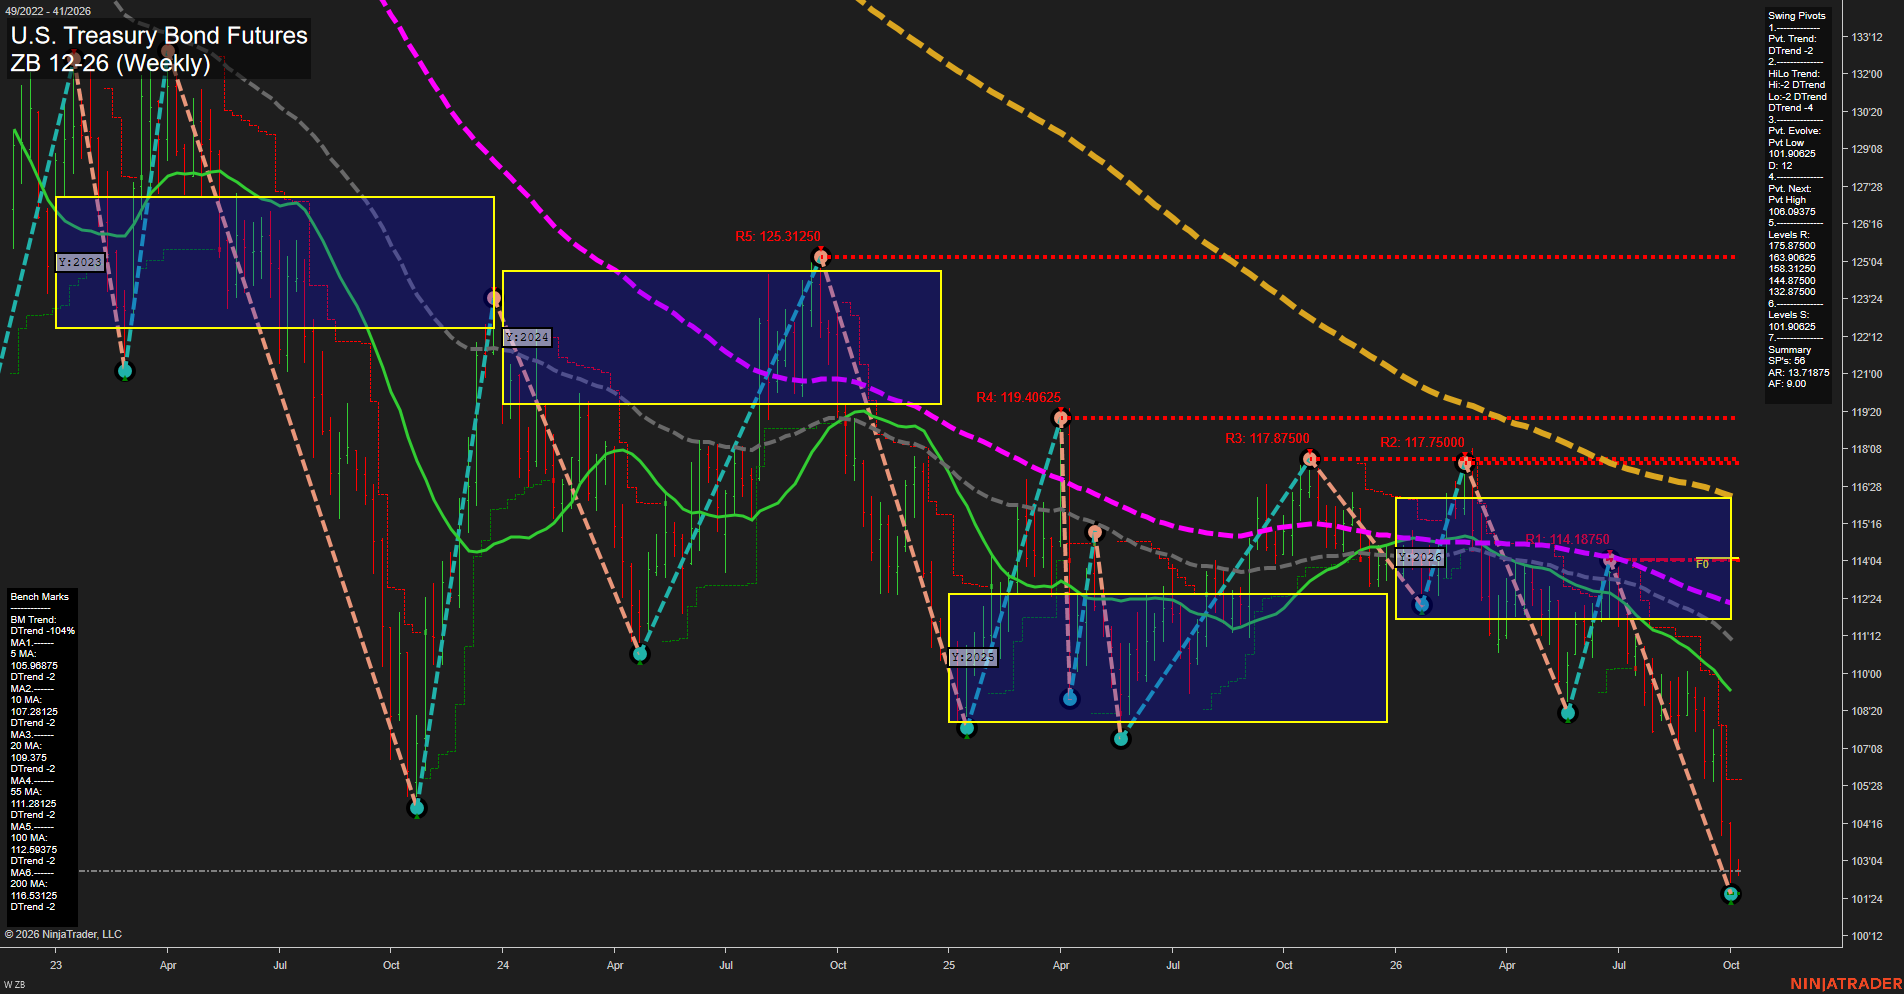
ZB U.S. Treasury Bond Futures Weekly Chart Analysis: 2026-Oct-05 07:13 CT
Price Action
- Last: 102'16,
- Bars: Large,
- Mom: fast.
WSFG Weekly
- Short-Term
- WSFG Current: -2%
- F0%/NTZ' Bias: Price Below,
- WSFG Trend: Down.
MSFG Month Oct
- Intermediate-Term
- MSFG Current: -3%
- F0%/NTZ' Bias: Price Below,
- MSFG Trend: Down.
YSFG Year 2026
- Long-Term
- YSFG Current: -51%
- F0%/NTZ' Bias: Price Below,
- YSFG Trend: Down.
Swing Pivots
- (Short-Term) 1. Pvt. Trend: DTrend,
- (Intermediate-Term) 2. HiLo Trend: DTrend,
- 3. Pvt. Evolve: Pvt low 101'29,
- 4. Pvt. Next: Pvt high 106'03,
- 5. Levels R: 175'28, 163'29, 158'10, 148'28, 132'28,
- 6. Levels S: 101'29.
Weekly Benchmarks
- (Short-Term) 5 Day: 105'31 Down Trend,
- (Short-Term) 10 Day: 107'09 Down Trend,
- (Intermediate-Term) 20 Day: 109'30 Down Trend,
- (Intermediate-Term) 55 Day: 111'09 Down Trend,
- (Long-Term) 100 Day: 112'19 Down Trend,
- (Long-Term) 200 Day: 116'17 Down Trend.
Overall Rating
- Short-Term: Bearish,
- Intermediate-Term: Bearish,
- Long-Term: Bearish.
Key Insights Summary
ZB is in a broad, persistent weekly decline, with fast downside momentum and large-range bars extending beneath the weekly, monthly, and yearly Fib-grid balance areas. Both pivot structures remain in DTrend, confirming lower highs and lower lows, while price trades below every benchmark average from the 5-period through the 200-period measure. The current evolving low near 101'29 is the immediate structural reference, while 106'03 is the reversal threshold required to establish the next opposing pivot high. The alignment of bearish Fib-grid readings, declining moving averages, and downside swing-pivot structure reflects a strongly directional selloff rather than a balanced consolidation.
Chart Analysis ATS AI Generated: 2026-10-05 07:13 for Informational use only, not trading advice. Terms and Risk Disclosure Copyright © 2026. Algo Trading Systems LLC.