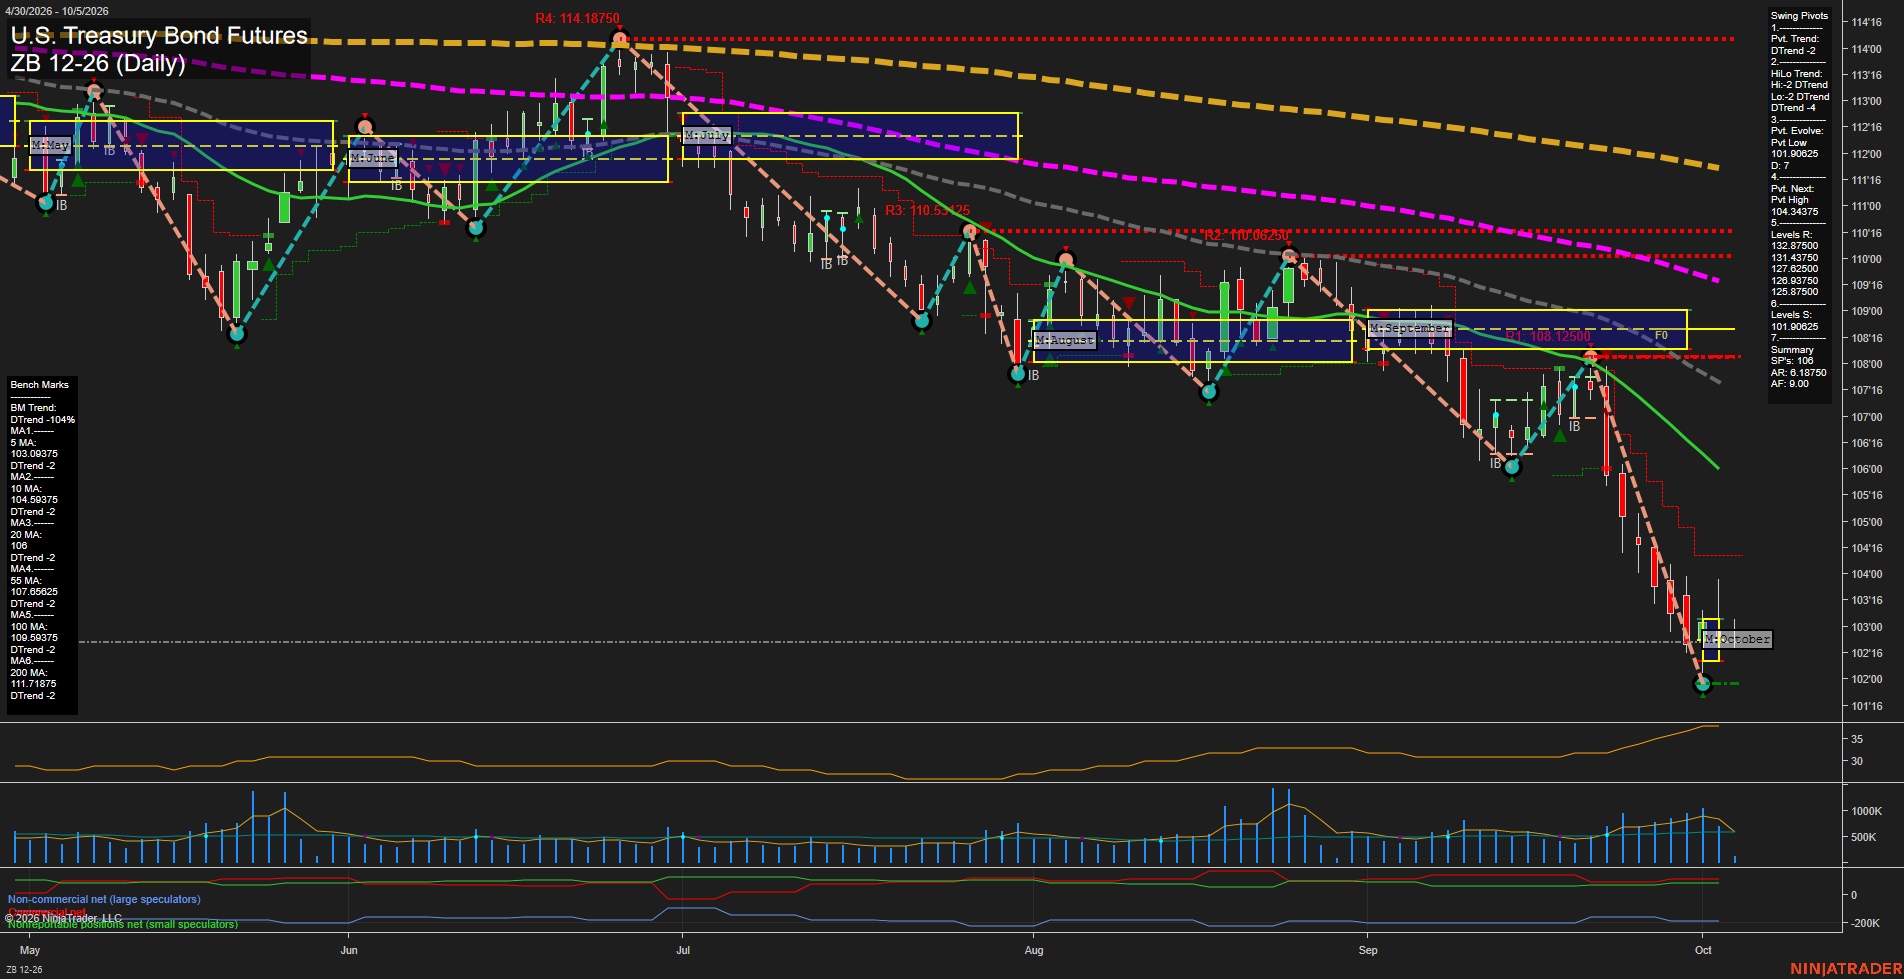
ZB U.S. Treasury Bond Futures Daily Chart Analysis: 2026-Oct-05 07:12 CT
Price Action
- Last: 102.19375,
- Bars: Large,
- Mom: fast.
WSFG Weekly
- Short-Term
- WSFG Current: -2%
- F0%/NTZ' Bias: Price Below,
- WSFG Trend: Down.
MSFG Month Oct
- Intermediate-Term
- MSFG Current: -3%
- F0%/NTZ' Bias: Price Below,
- MSFG Trend: Down.
YSFG Year 2026
- Long-Term
- YSFG Current: -51%
- F0%/NTZ' Bias: Price Below,
- YSFG Trend: Down.
Swing Pivots
- (Short-Term) 1. Pvt. Trend: DTrend,
- (Intermediate-Term) 2. HiLo Trend: DTrend,
- 3. Pvt. Evolve: Pvt low 101.90625,
- 4. Pvt. Next: Pvt high 104.34375,
- 5. Levels R: 132.87500, 131.43750, 128.93750, 127.62500, 125.87500,
- 6. Levels S: 101.90625.
Daily Benchmarks
- (Short-Term) 5 Day: 103.09375 Down Trend,
- (Short-Term) 10 Day: 104.59375 Down Trend,
- (Intermediate-Term) 20 Day: 106.00000 Down Trend,
- (Intermediate-Term) 55 Day: 107.85625 Down Trend,
- (Long-Term) 100 Day: 109.69375 Down Trend,
- (Long-Term) 200 Day: 111.71875 Down Trend.
Additional Metrics
Overall Rating
- Short-Term: Bearish,
- Intermediate-Term: Bearish,
- Long-Term: Bearish.
Key Insights Summary
Price is in a broad, accelerating daily decline, with a sequence of lower highs and lower lows confirmed by bearish short-term and intermediate-term pivot structures. The contract is below every benchmark average and below the October monthly grid, while the 5-day average remains beneath the 10-day average and both slope lower. The recent selloff expanded daily ranges and lifted ATR toward 35, indicating elevated directional volatility. The 101.90625 pivot low is the nearest structural support, while 104.34375 is the first pivot-reversal threshold and the 5-day average near 103.09375 is the closest benchmark overhead. The technical backdrop remains trend-continuation bearish rather than a completed base or recovery pattern.
Chart Analysis ATS AI Generated: 2026-10-05 07:13 for Informational use only, not trading advice. Terms and Risk Disclosure Copyright © 2026. Algo Trading Systems LLC.