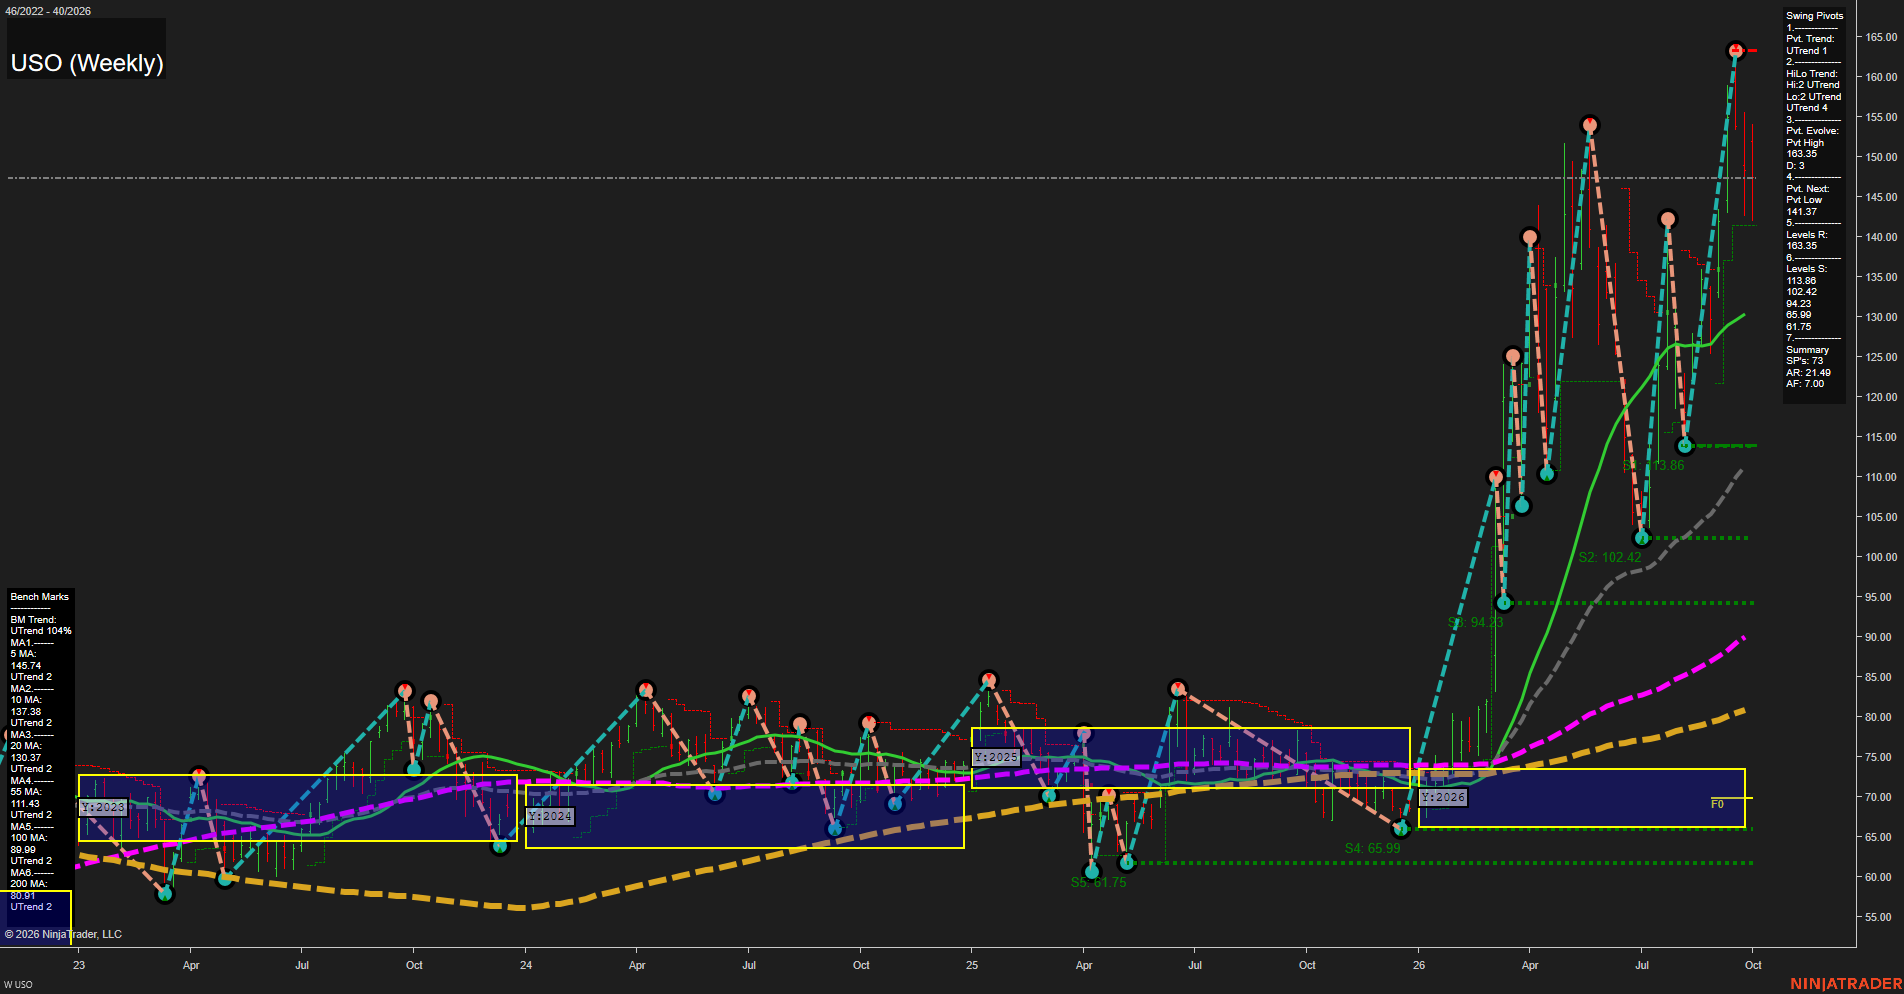
USO United States Oil Fund LP Weekly Chart Analysis: 2026-Oct-05 07:12 CT
Price Action
- Last: 142.42,
- Bars: Large,
- Mom: Fast.
WSFG Weekly
- Short-Term
- WSFG Current: NA%
- F0%/NTZ' Bias: Price Above NTZ,
- WSFG Trend: Bullish.
MSFG Month Oct
- Intermediate-Term
- MSFG Current: NA%
- F0%/NTZ' Bias: Price Above NTZ,
- MSFG Trend: Bullish.
YSFG Year 2026
- Long-Term
- YSFG Current: NA%
- F0%/NTZ' Bias: Price Above NTZ,
- YSFG Trend: Bullish.
Swing Pivots
- (Short-Term) 1. Pvt. Trend: UTrend,
- (Intermediate-Term) 2. HiLo Trend: UTrend,
- 3. Pvt. Evolve: Pvt high 163.35,
- 4. Pvt. Next: Pvt low 141.37,
- 5. Levels R: 163.35,
- 6. Levels S: 142.42, 94.23, 65.99, 61.75.
Weekly Benchmarks
- (Short-Term) 5 Day: 145.74 Up Trend,
- (Short-Term) 10 Day: 137.38 Up Trend,
- (Intermediate-Term) 20 Day: 130.37 Up Trend,
- (Intermediate-Term) 55 Day: 111.43 Up Trend,
- (Long-Term) 100 Day: 89.99 Up Trend,
- (Long-Term) 200 Day: 80.81 Up Trend.
Overall Rating
- Short-Term: Bullish,
- Intermediate-Term: Bullish,
- Long-Term: Bullish.
Key Insights Summary
USO reflects an exceptionally strong crude-oil-linked expansion phase, with price substantially above the yearly neutral zone and every benchmark average rising. The weekly pivot structure remains an UTrend, although the large rejection from the 163.35 pivot high has created fast, wide-range countertrend volatility. From a futures swing-trader perspective, 141.37 is the immediate structural pivot threshold; holding above it preserves the current higher-high/higher-low sequence, while 163.35 remains the dominant overhead pivot reference. The wide separation above the 20-, 55-, 100-, and 200-week benchmarks indicates a mature momentum advance rather than a low-volatility consolidation.
Chart Analysis ATS AI Generated: 2026-10-05 07:12 for Informational use only, not trading advice. Terms and Risk Disclosure Copyright © 2026. Algo Trading Systems LLC.