SPI ASX SPI 200 Index Futures Weekly Chart Analysis: 2026-Oct-05 07:10 CT
Price Action
- Last: 8740,
- Bars: Medium,
- Mom: Average.
WSFG Weekly
- Short-Term
- WSFG Current: NA%
- F0%/NTZ' Bias: Price Neutral,
- WSFG Trend: Neutral.
MSFG Month Oct
- Intermediate-Term
- MSFG Current: NA%
- F0%/NTZ' Bias: Price Neutral,
- MSFG Trend: Neutral.
YSFG Year 2026
- Long-Term
- YSFG Current: -1.1%
- F0%/NTZ' Bias: Price Below F0% in NTZ Lower,
- YSFG Trend: Neutral.
Swing Pivots
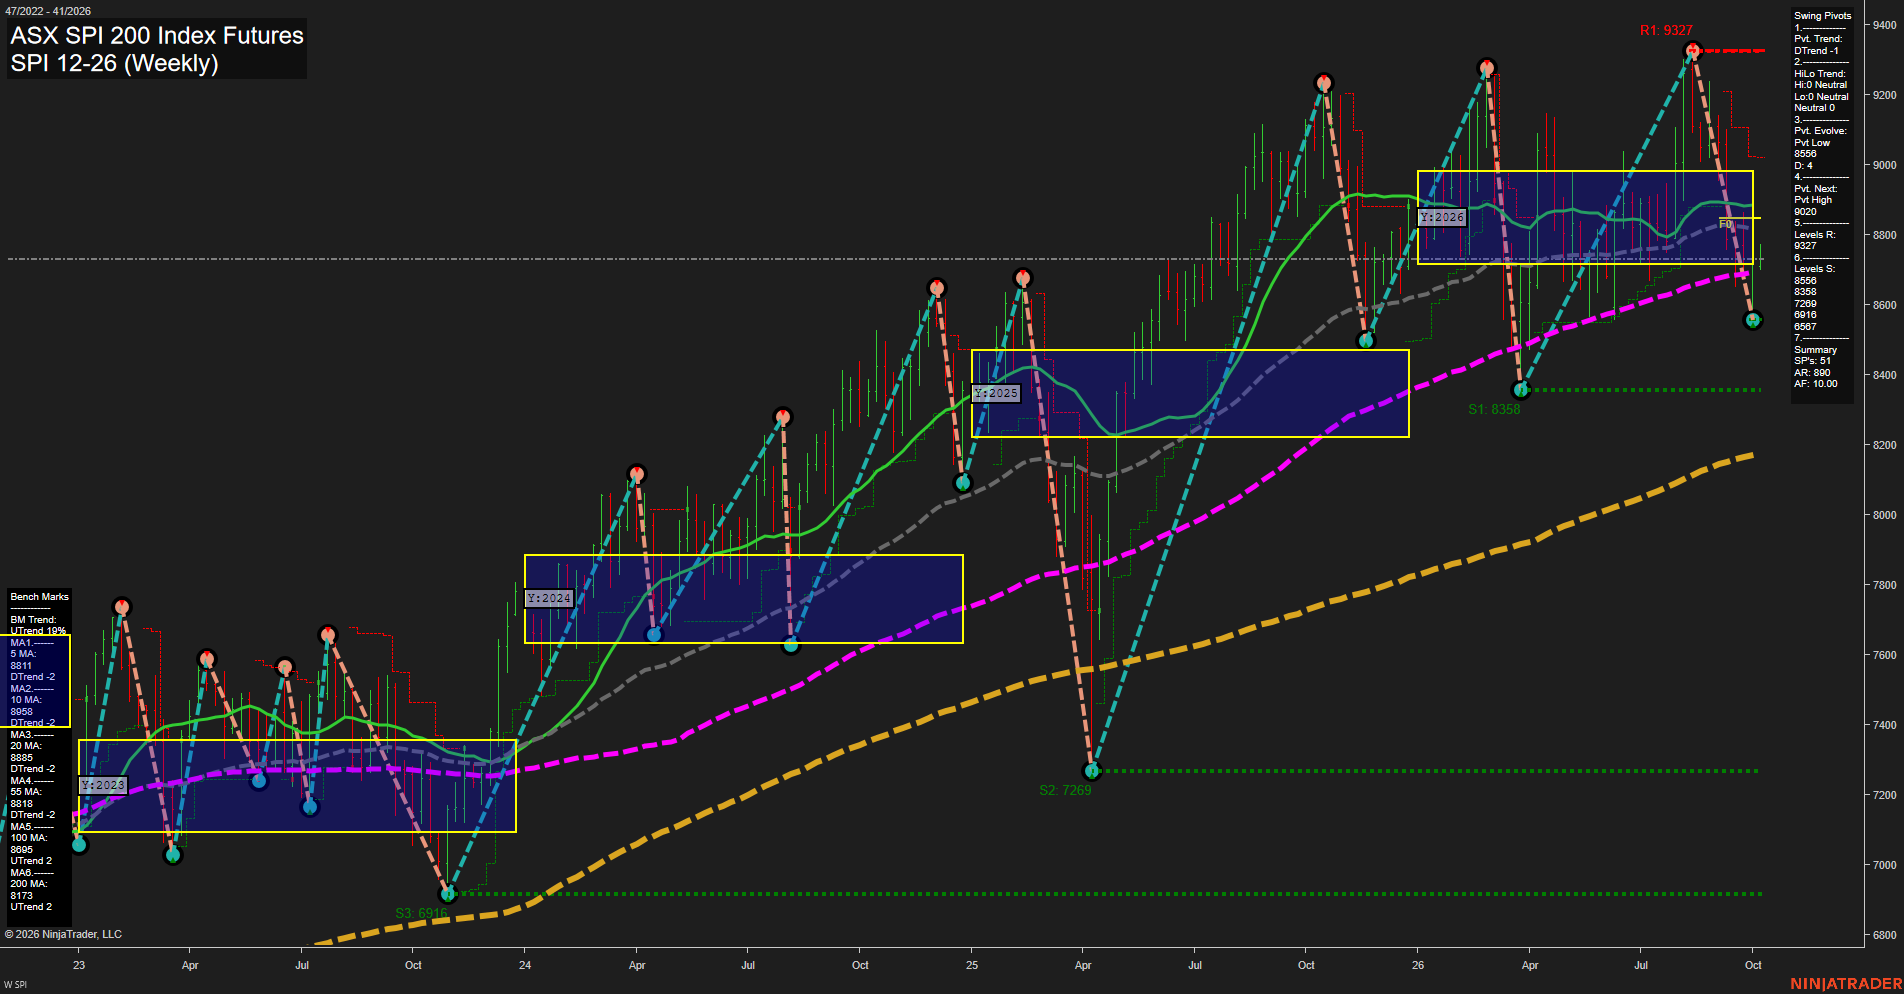
- (Short-Term) 1. Pvt. Trend: DTrend,
- (Intermediate-Term) 2. HiLo Trend: Neutral,
- 3. Pvt. Evolve: Pvt low 8558,
- 4. Pvt. Next: Pvt high 9020,
- 5. Levels R: 9327,
- 6. Levels S: 8558, 8358, 7269, 6916, 6567.
Weekly Benchmarks
- (Short-Term) 5 Day: 8811 Down Trend,
- (Short-Term) 10 Day: 8958 Down Trend,
- (Intermediate-Term) 20 Day: 8835 Down Trend,
- (Intermediate-Term) 55 Day: 8818 Down Trend,
- (Long-Term) 100 Day: 8695 Up Trend,
- (Long-Term) 200 Day: 8173 Up Trend.
Overall Rating
- Short-Term: Bearish,
- Intermediate-Term: Neutral,
- Long-Term: Bullish.
Key Insights Summary
The weekly structure is in a short-term downswing from the 9327 pivot high, with the developing 8558 pivot low defining the immediate downside swing reference. Price has rebounded from that low but remains below the declining 5, 10, 20, and 55-week benchmarks, reflecting a counter-trend recovery rather than a confirmed short-term trend reversal. The 2026 yearly grid places price in the lower NTZ and below its F0% area, while the intermediate HiLo pivot structure remains neutral. Longer-term structure remains constructive because price is still above rising 100- and 200-week benchmarks, leaving the market in a broad bullish primary trend but a choppy, corrective weekly phase.
Chart Analysis ATS AI Generated: 2026-10-05 07:10 for Informational use only, not trading advice. Terms and Risk Disclosure Copyright © 2026. Algo Trading Systems LLC.