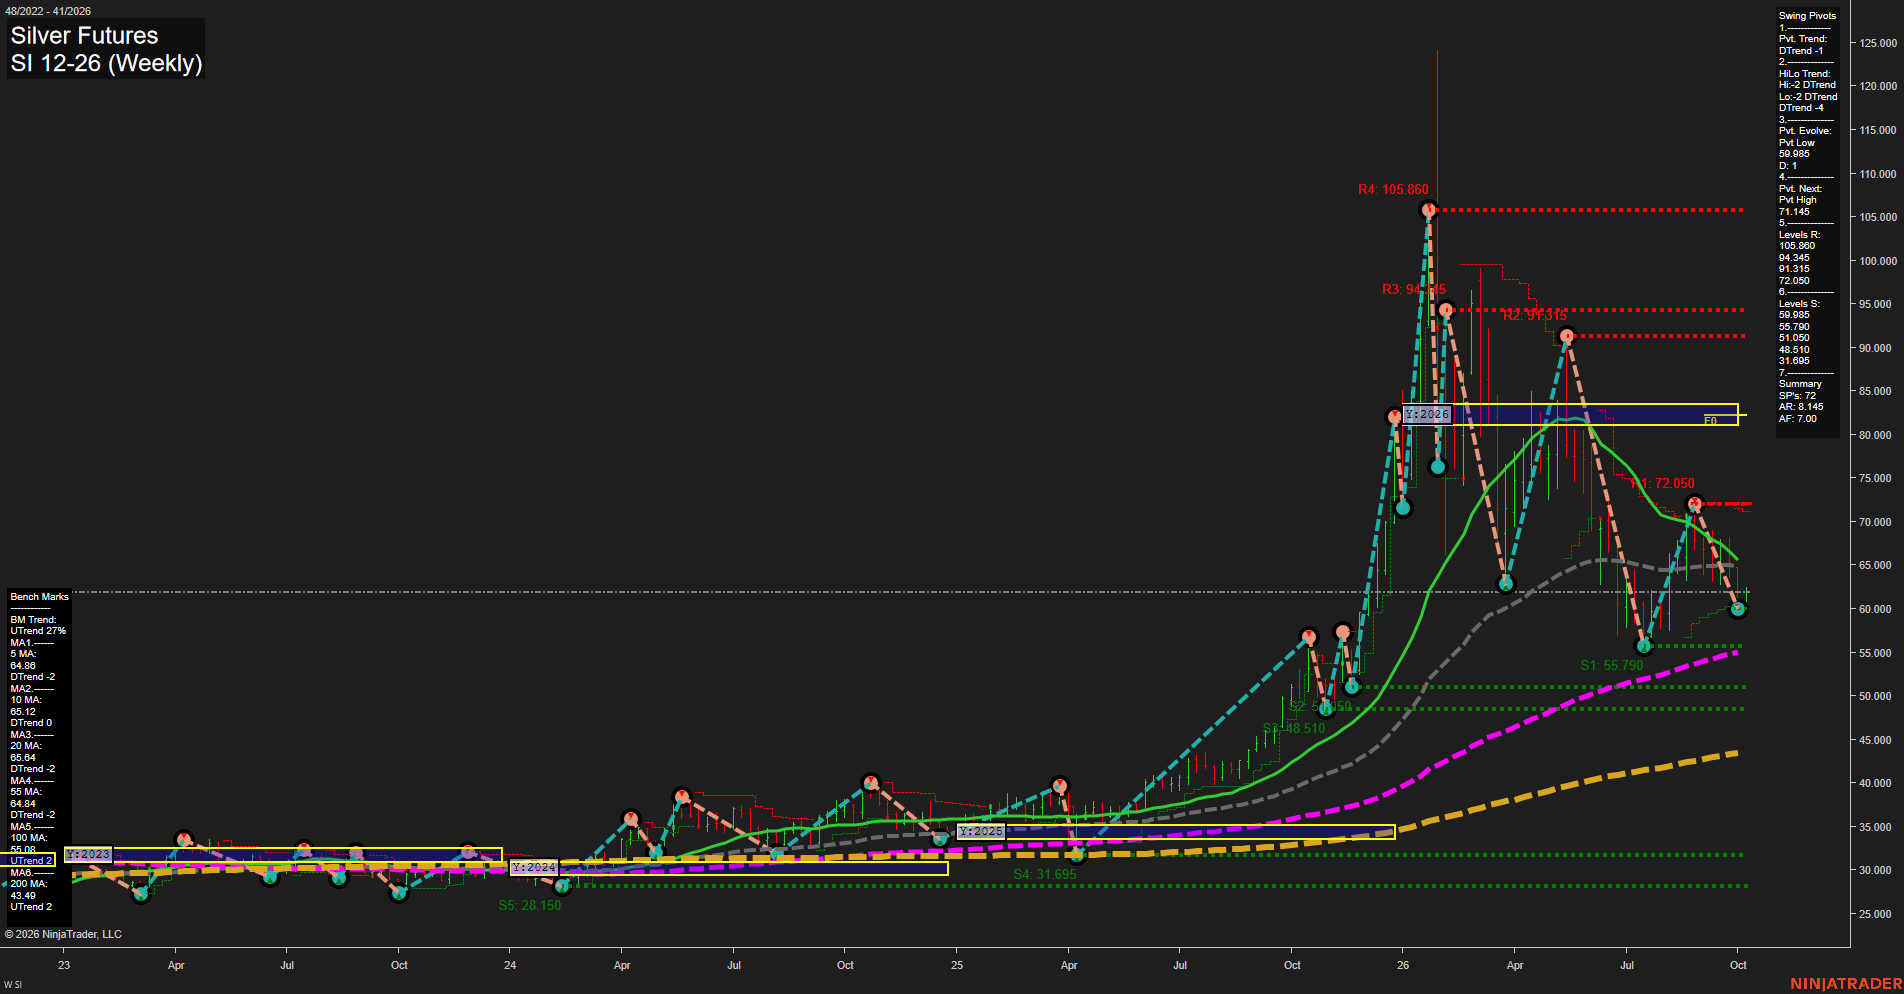
SI Silver Futures Weekly Chart Analysis: 2026-Oct-05 07:09 CT
Price Action
- Last: 61.99,
- Bars: Large,
- Mom: Fast.
WSFG Weekly
- Short-Term
- WSFG Current: 28%
- F0%/NTZ' Bias: Price Above,
- WSFG Trend: Up.
MSFG Month Oct
- Intermediate-Term
- MSFG Current: 5%
- F0%/NTZ' Bias: Price Above,
- MSFG Trend: Up.
YSFG Year 2026
- Long-Term
- YSFG Current: -165%
- F0%/NTZ' Bias: Price Below,
- YSFG Trend: Down.
Swing Pivots
- (Short-Term) 1. Pvt. Trend: DTrend,
- (Intermediate-Term) 2. HiLo Trend: DTrend,
- 3. Pvt. Evolve: Pvt low 59.985,
- 4. Pvt. Next: Pvt high 71.145,
- 5. Levels R: 105.860, 94.345, 91.315, 72.050,
- 6. Levels S: 59.985, 55.790, 50.105, 48.510, 31.695.
Weekly Benchmarks
- (Short-Term) 5 Day: 64.86 Down Trend,
- (Short-Term) 10 Day: 65.12 Down Trend,
- (Intermediate-Term) 20 Day: 65.64 Down Trend,
- (Intermediate-Term) 55 Day: 64.84 Down Trend,
- (Long-Term) 100 Day: 55.03 Up Trend,
- (Long-Term) 200 Day: 43.48 Up Trend.
Recent Trade Signals
- 05 Oct 2026: Long SI 12-26 @ 61.99 Signals.USAR.TR120
- 28 Sep 2026: Short SI 12-26 @ 64.14 Signals.USAR-MSFG
Overall Rating
- Short-Term: Bearish,
- Intermediate-Term: Bearish,
- Long-Term: Neutral.
Key Insights Summary
Silver remains in a high-volatility corrective phase after the prior explosive advance. Price is beneath the declining 5, 10, 20, and 55-week benchmarks, while both pivot structures remain in DTrend, defining 64.84-65.64 as nearby overhead trend pressure and 71.145 as the reversal-pivot threshold. The 59.985 pivot low is the immediate structural reference, followed by support at 55.790, 50.105, and 48.510. The weekly and monthly fib grids remain positive, but the yearly grid remains below its F0% reference and retains a downtrend condition. Longer-term moving averages continue higher, leaving the broader structure as a pullback within an earlier major advance rather than a fully synchronized long-term bearish trend.
Chart Analysis ATS AI Generated: 2026-10-05 07:10 for Informational use only, not trading advice. Terms and Risk Disclosure Copyright © 2026. Algo Trading Systems LLC.