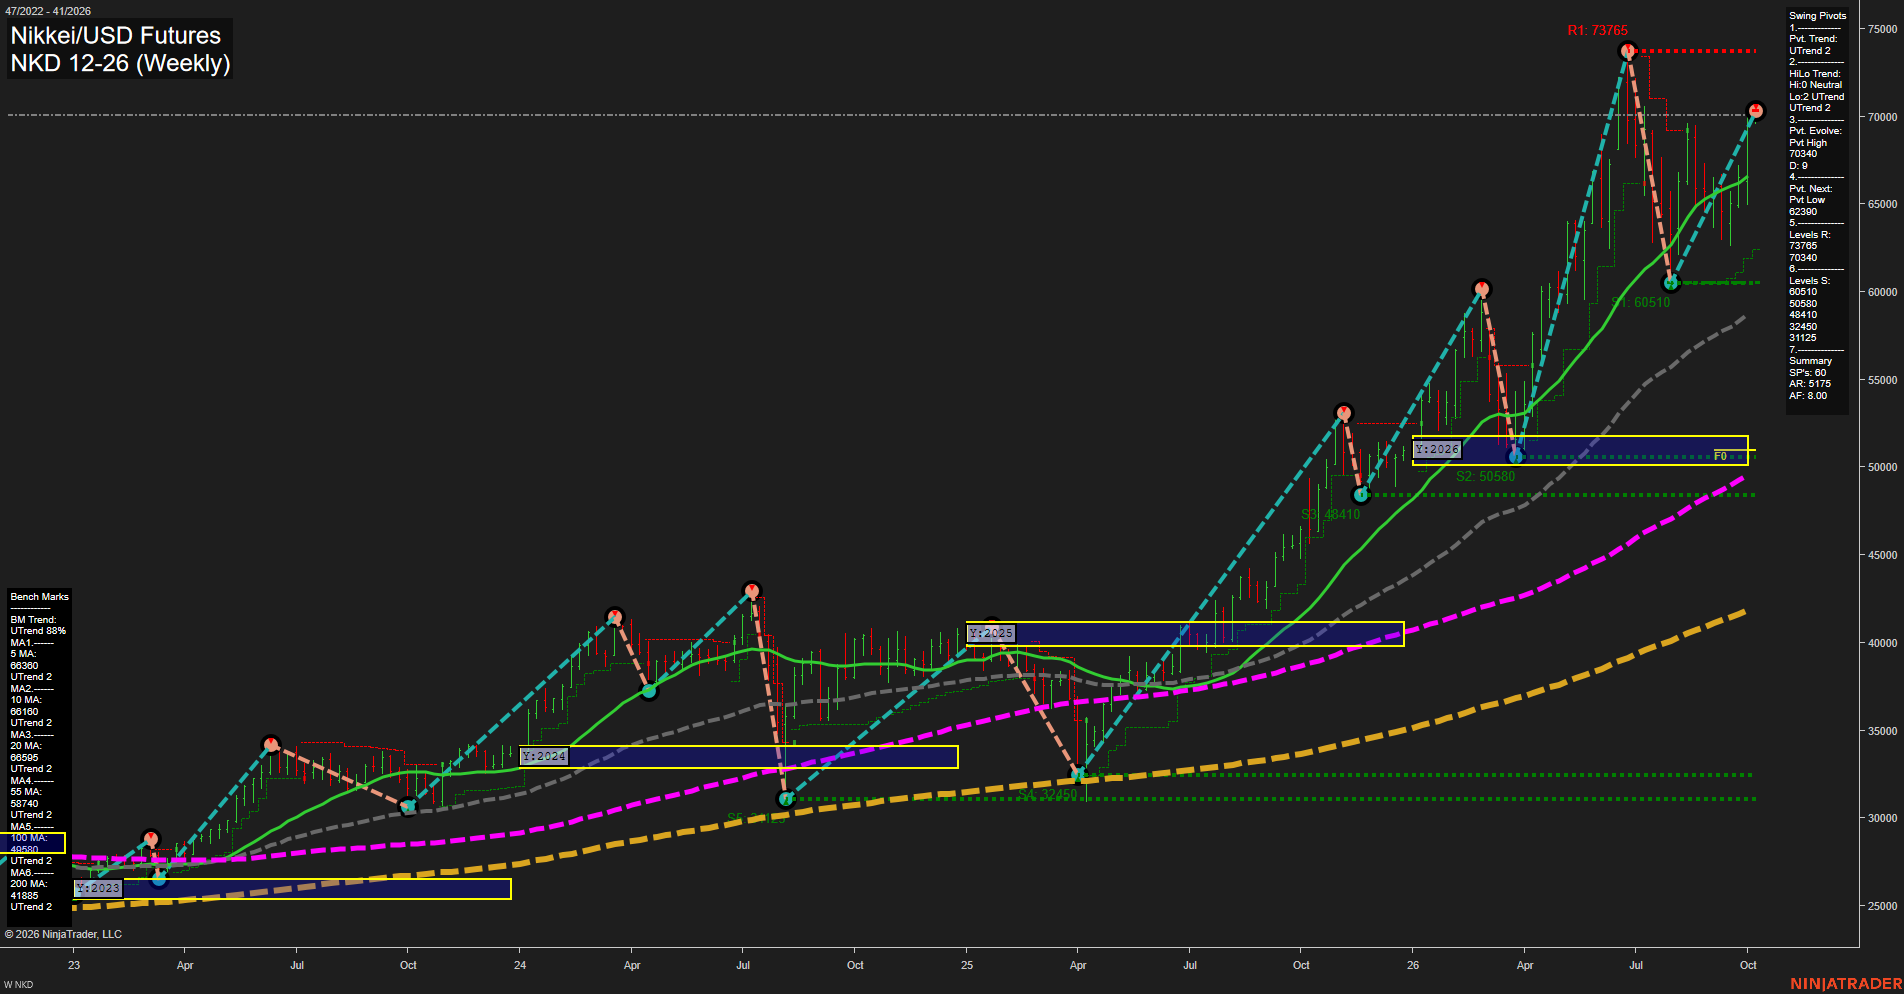
NKD Nikkei/USD Futures Weekly Chart Analysis: 2026-Oct-05 07:07 CT
Price Action
- Last: 70000,
- Bars: Large,
- Mom: fast.
WSFG Weekly
- Short-Term
- WSFG Current: 4%
- F0%/NTZ' Bias: Price Above,
- WSFG Trend: Up.
MSFG Month Oct
- Intermediate-Term
- MSFG Current: 15%
- F0%/NTZ' Bias: Price Above,
- MSFG Trend: Up.
YSFG Year 2026
- Long-Term
- YSFG Current: 230%
- F0%/NTZ' Bias: Price Above,
- YSFG Trend: Up.
Swing Pivots
- (Short-Term) 1. Pvt. Trend: UTrend,
- (Intermediate-Term) 2. HiLo Trend: UTrend,
- 3. Pvt. Evolve: Pvt high 70340,
- 4. Pvt. Next: Pvt low 62390,
- 5. Levels R: 73765, 70340,
- 6. Levels S: 60510, 50580, 48410, 32450, 31125, 28880.
Weekly Benchmarks
- (Short-Term) 5 Day: 63840 Up Trend,
- (Short-Term) 10 Day: 66100 Up Trend,
- (Intermediate-Term) 20 Day: 65095 Up Trend,
- (Intermediate-Term) 55 Day: 58740 Up Trend,
- (Long-Term) 100 Day: 49580 Up Trend,
- (Long-Term) 200 Day: 41880 Up Trend.
Recent Trade Signals
- 01 Oct 2026: Long NKD 12-26 @ 67330 Signals.USAR-MSFG
Overall Rating
- Short-Term: Bullish,
- Intermediate-Term: Bullish,
- Long-Term: Bullish.
Key Insights Summary
NKD remains in a broad weekly uptrend, with price recovering toward the 70340 pivot-high area after holding well above the rising 20-, 55-, 100-, and 200-week benchmarks. The large weekly bars and fast momentum reflect elevated directional volatility following the sharp retracement from 73765. The pivot structure remains constructive, with the 62390 reversal threshold defining the current short-term higher-low framework. Resistance is concentrated at 70340 and 73765, while 60510 is the nearest major support beneath the current advance. Price remains above the weekly, monthly, and yearly F0%/NTZ structures, confirming aligned bullish trend conditions across all three swing horizons.
Chart Analysis ATS AI Generated: 2026-10-05 07:07 for Informational use only, not trading advice. Terms and Risk Disclosure Copyright © 2026. Algo Trading Systems LLC.