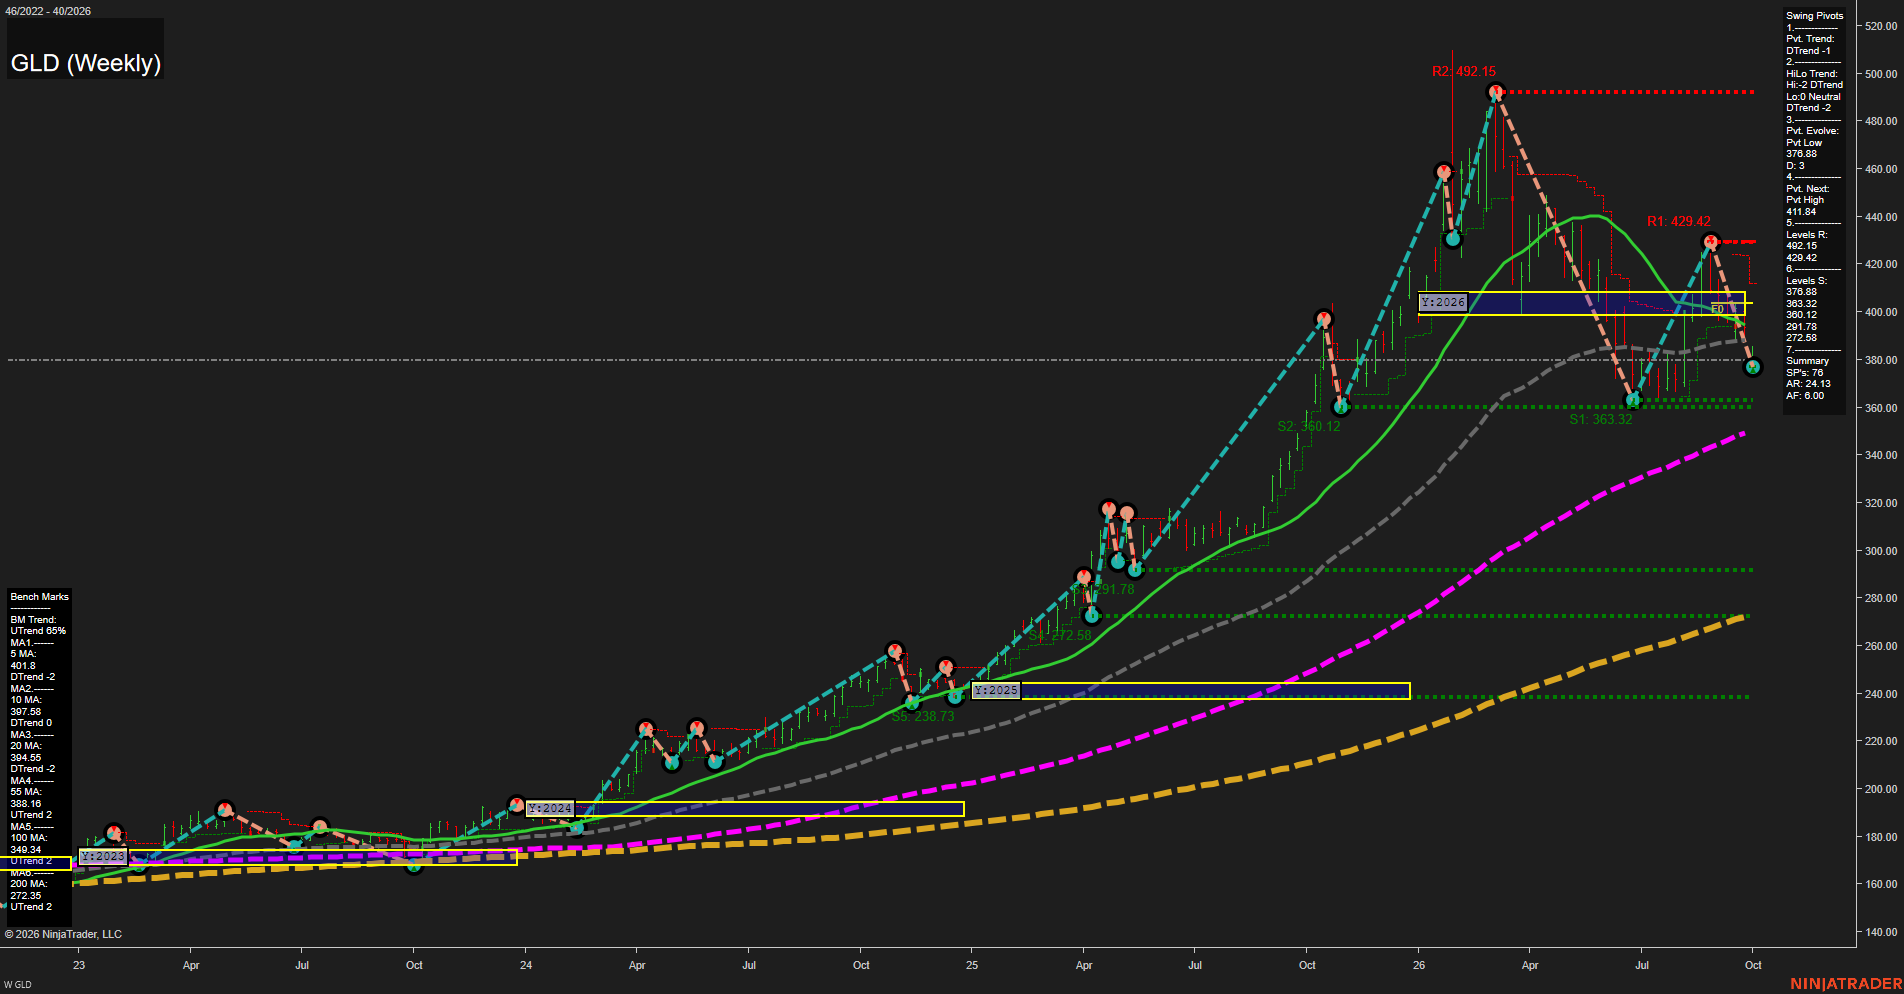
GLD SPDR Gold Shares Weekly Chart Analysis: 2026-Oct-05 07:06 CT
Price Action
- Last: 376.89,
- Bars: Large,
- Mom: fast.
WSFG Weekly
- Short-Term
- WSFG Current: NA%
- F0%/NTZ' Bias: Price Bearish,
- WSFG Trend: Bearish.
MSFG Month Oct
- Intermediate-Term
- MSFG Current: NA%
- F0%/NTZ' Bias: Price Bearish,
- MSFG Trend: Bearish.
YSFG Year 2026
- Long-Term
- YSFG Current: NA%
- F0%/NTZ' Bias: Price Bearish,
- YSFG Trend: Bearish.
Swing Pivots
- (Short-Term) 1. Pvt. Trend: DTrend,
- (Intermediate-Term) 2. HiLo Trend: DTrend,
- 3. Pvt. Evolve: Pvt low 376.88,
- 4. Pvt. Next: Pvt high 411.84,
- 5. Levels R: 492.15, 429.42,
- 6. Levels S: 376.88, 363.32, 360.12, 291.78, 272.58.
Weekly Benchmarks
- (Short-Term) 5 Day: 401.80 Down Trend,
- (Short-Term) 10 Day: 397.58 Down Trend,
- (Intermediate-Term) 20 Day: 394.55 Down Trend,
- (Intermediate-Term) 55 Day: 388.16 Up Trend,
- (Long-Term) 100 Day: 349.34 Up Trend,
- (Long-Term) 200 Day: 272.95 Up Trend.
Overall Rating
- Short-Term: Bearish,
- Intermediate-Term: Bearish,
- Long-Term: Bullish.
Key Insights Summary
GLD, a liquid proxy for gold-futures directional structure, is in a fast weekly countertrend decline. Price is below the 5, 10, 20, and 55-period benchmarks and beneath the 2026 yearly F0% area near 400.12, while the pivot summaries retain DTrend conditions. The active 376.88 pivot low is the immediate structural reference, with clustered lower supports at 363.32 and 360.12. The broader futures-style trend remains constructive because the 55, 100, and 200-period benchmarks are still rising, but the weekly swing sequence has shifted from the prior rally into lower-high and lower-low behavior beneath 429.42 resistance.
Chart Analysis ATS AI Generated: 2026-10-05 07:06 for Informational use only, not trading advice. Terms and Risk Disclosure Copyright © 2026. Algo Trading Systems LLC.